Visualization results#
See Fig. 23 to Fig. 27: As described in visualization, various graphs or maps are displayed if the visualization has been run and can be viewed when selecting Visualization results in the drop-down menu.
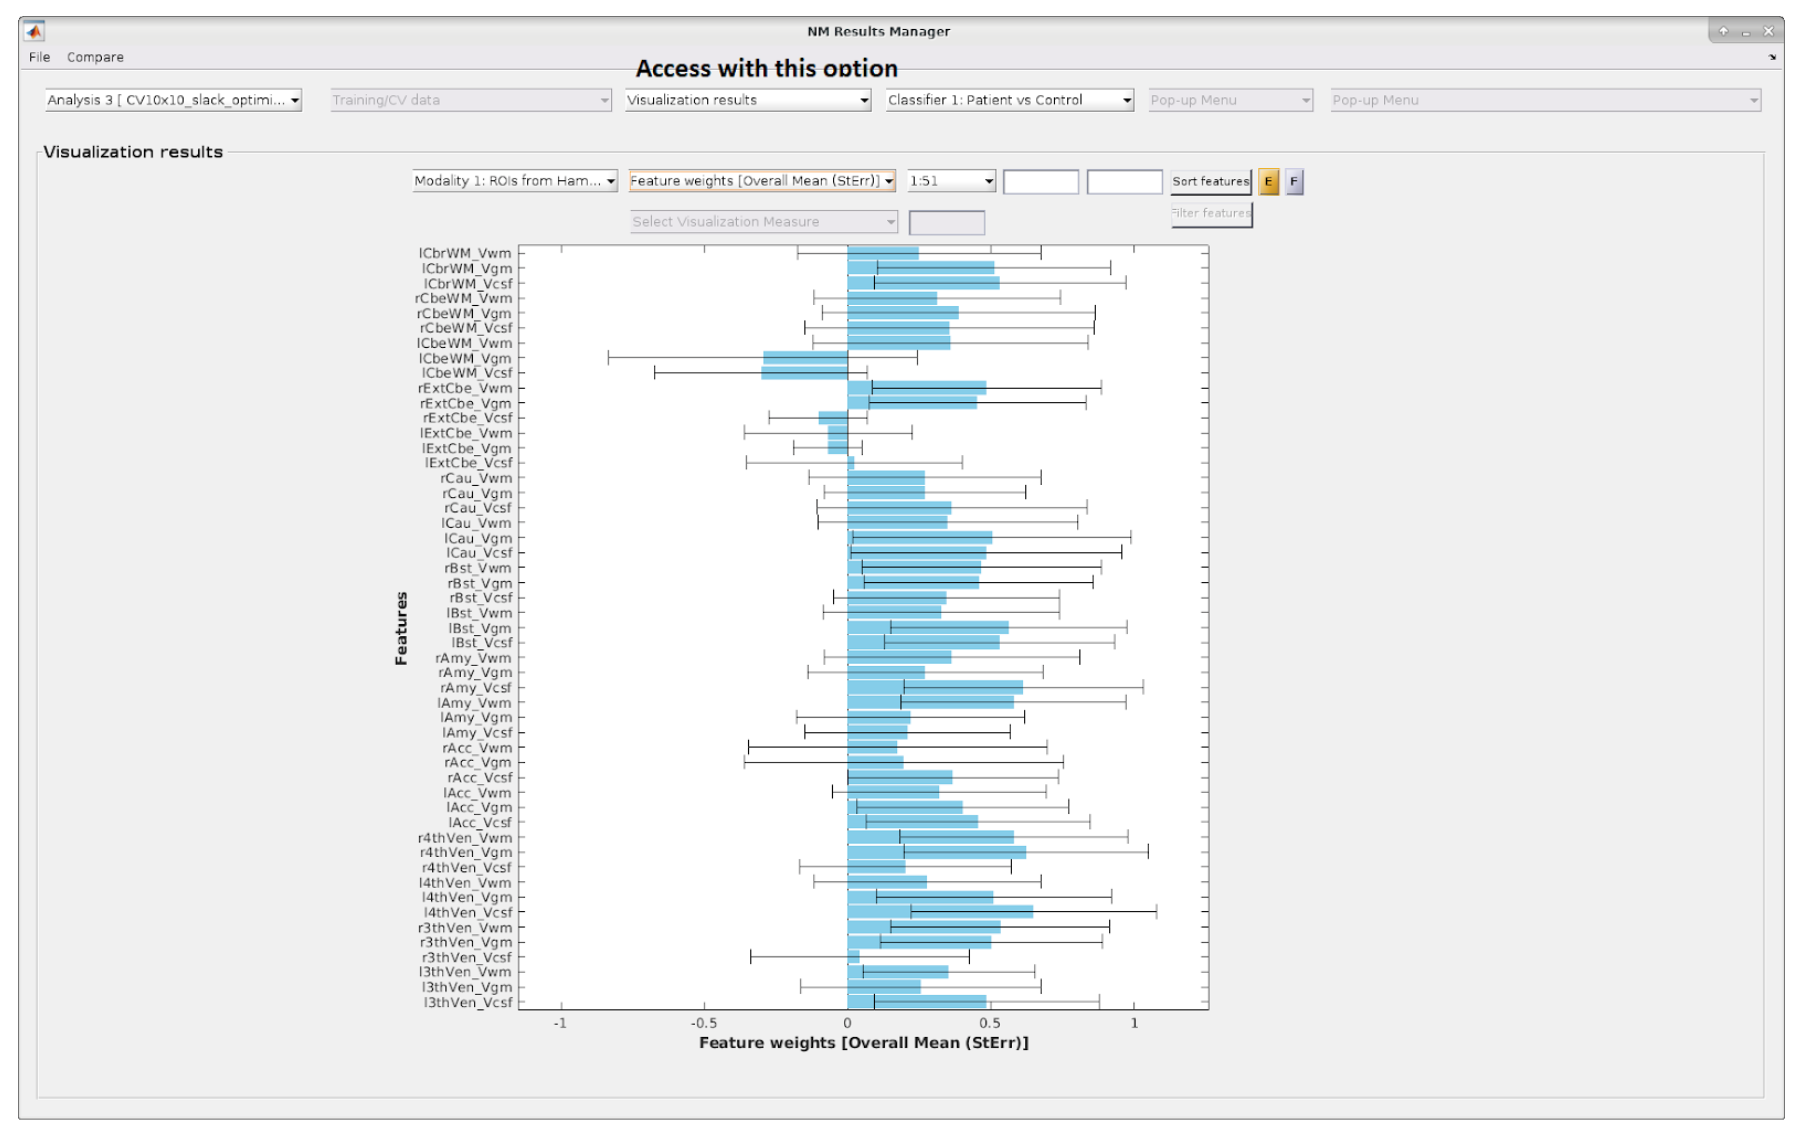
Fig. 23 Overall mean results including standard errors with matrix data.#
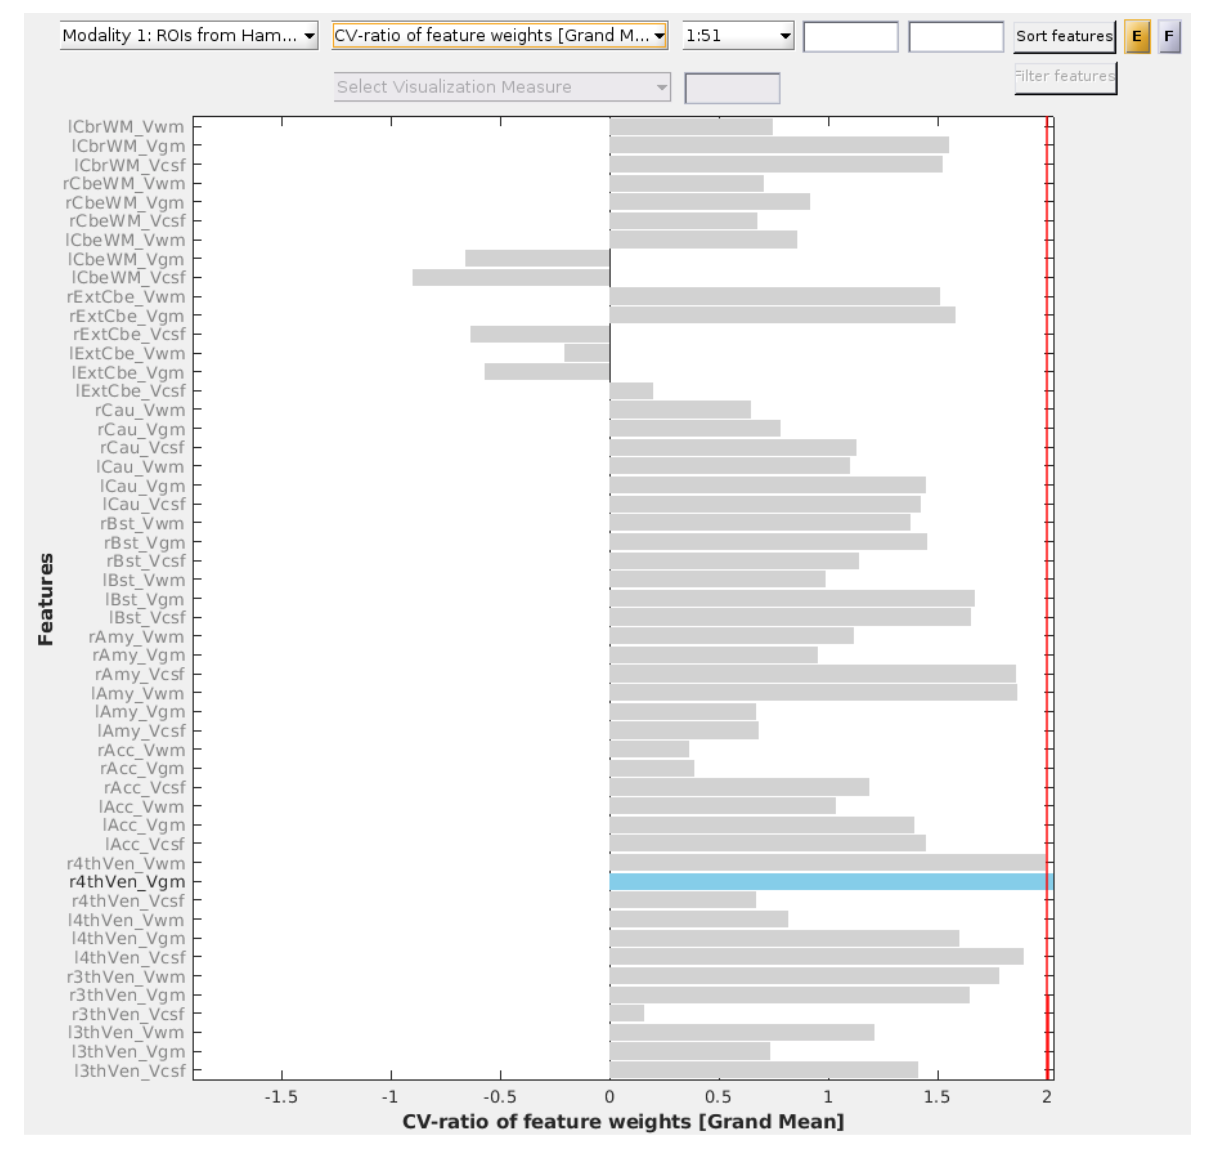
Fig. 24 CV-ratio of feature weights with matrix data.#
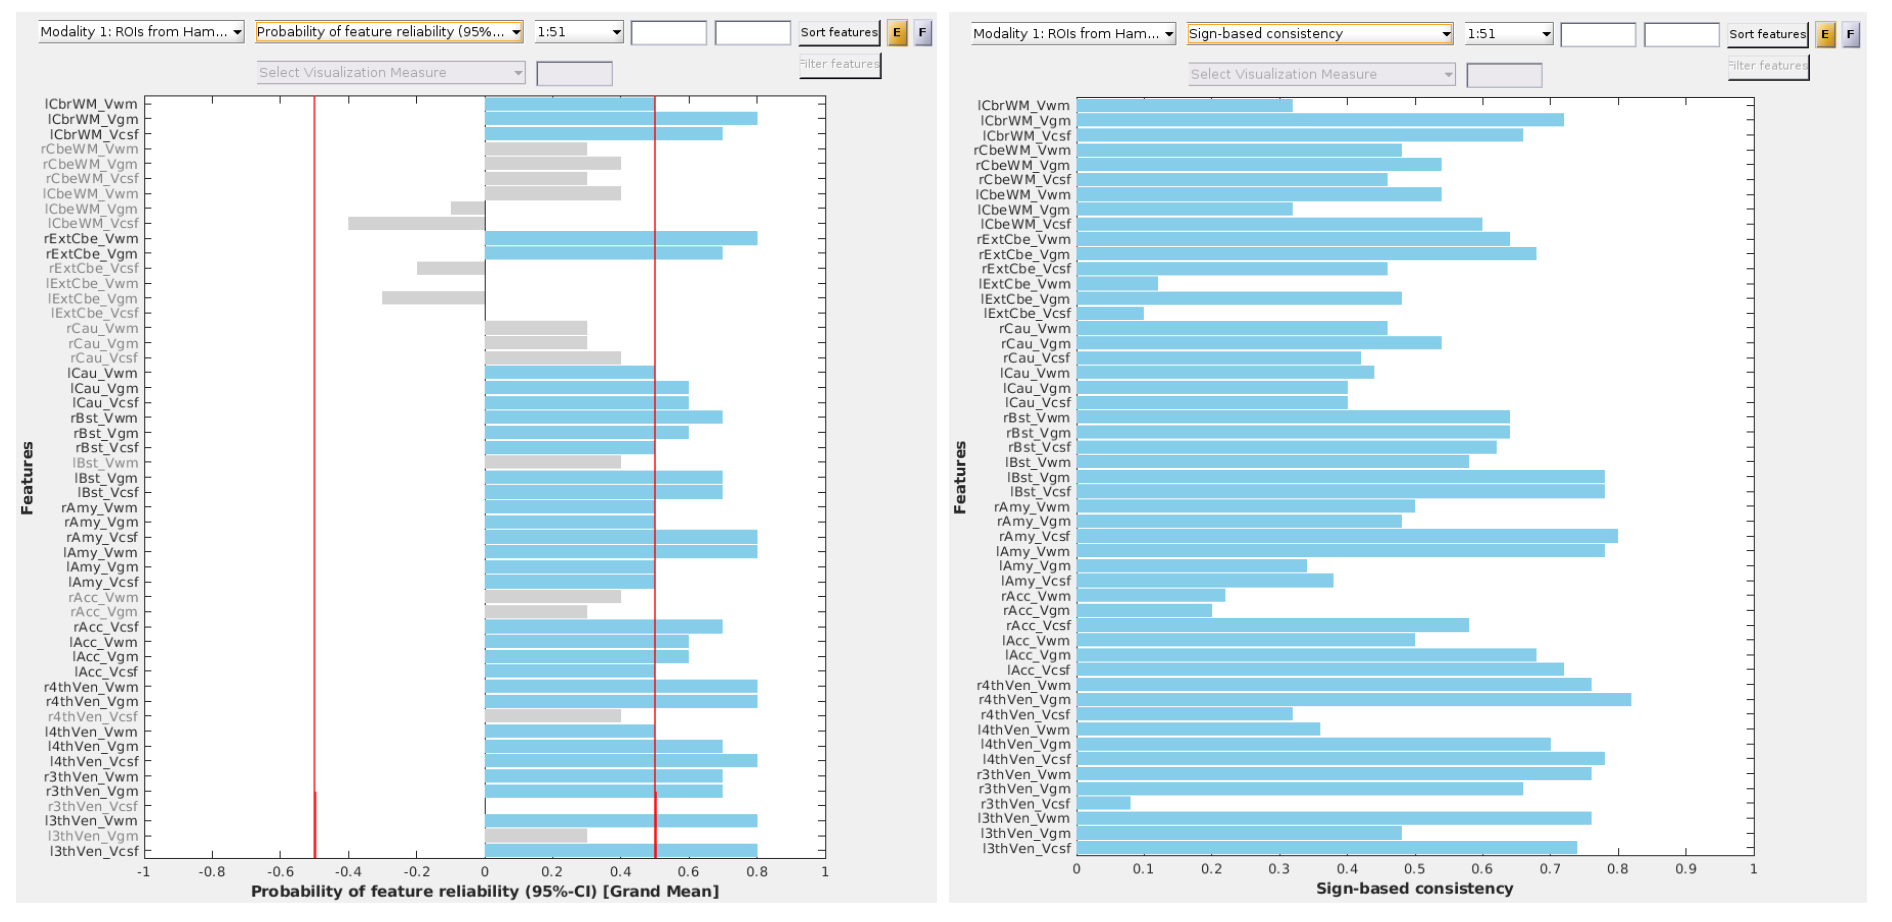
Fig. 25 Probability of feature reliability with matrix data.#
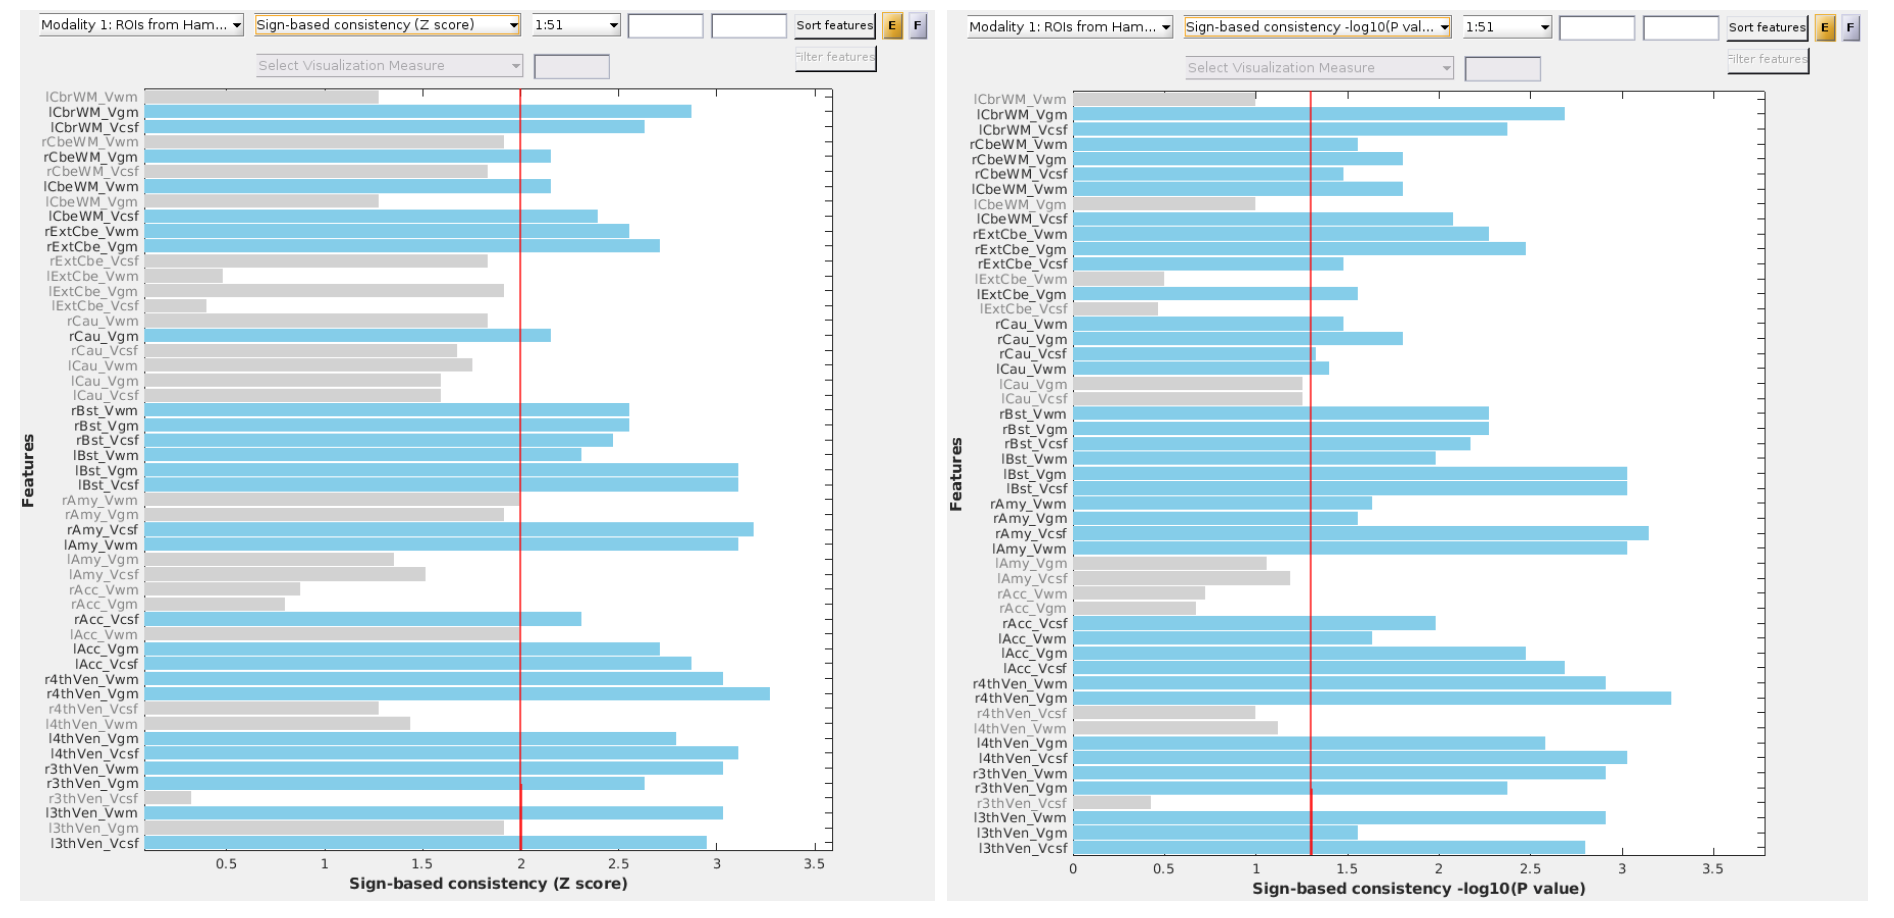
Fig. 26 Sign-based consistency (Z score) with matrix data.#
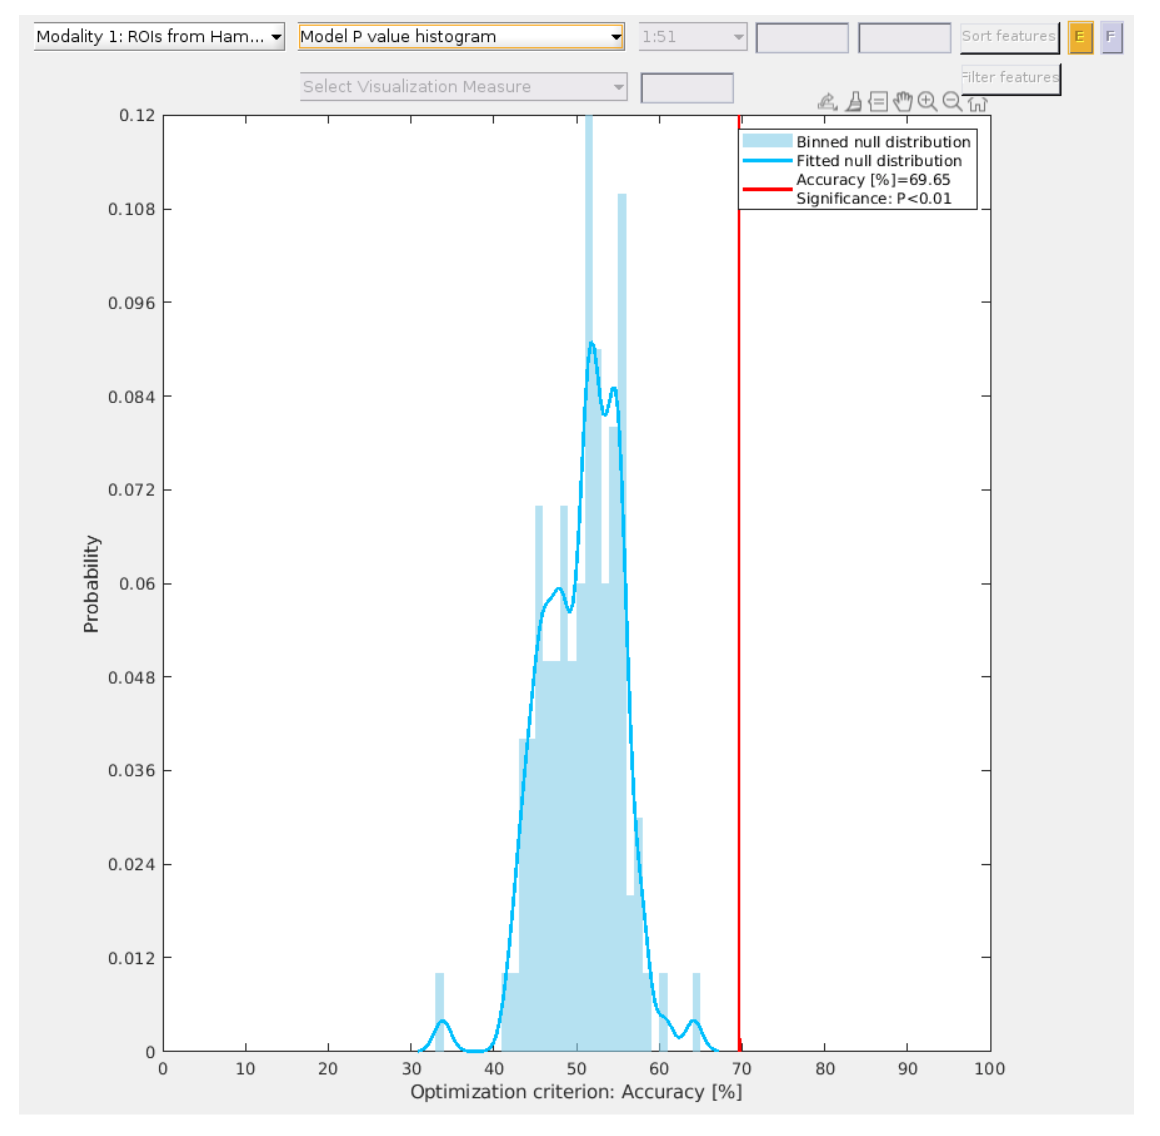
Fig. 27 Histogram of the p-values derived from permutation testing.#
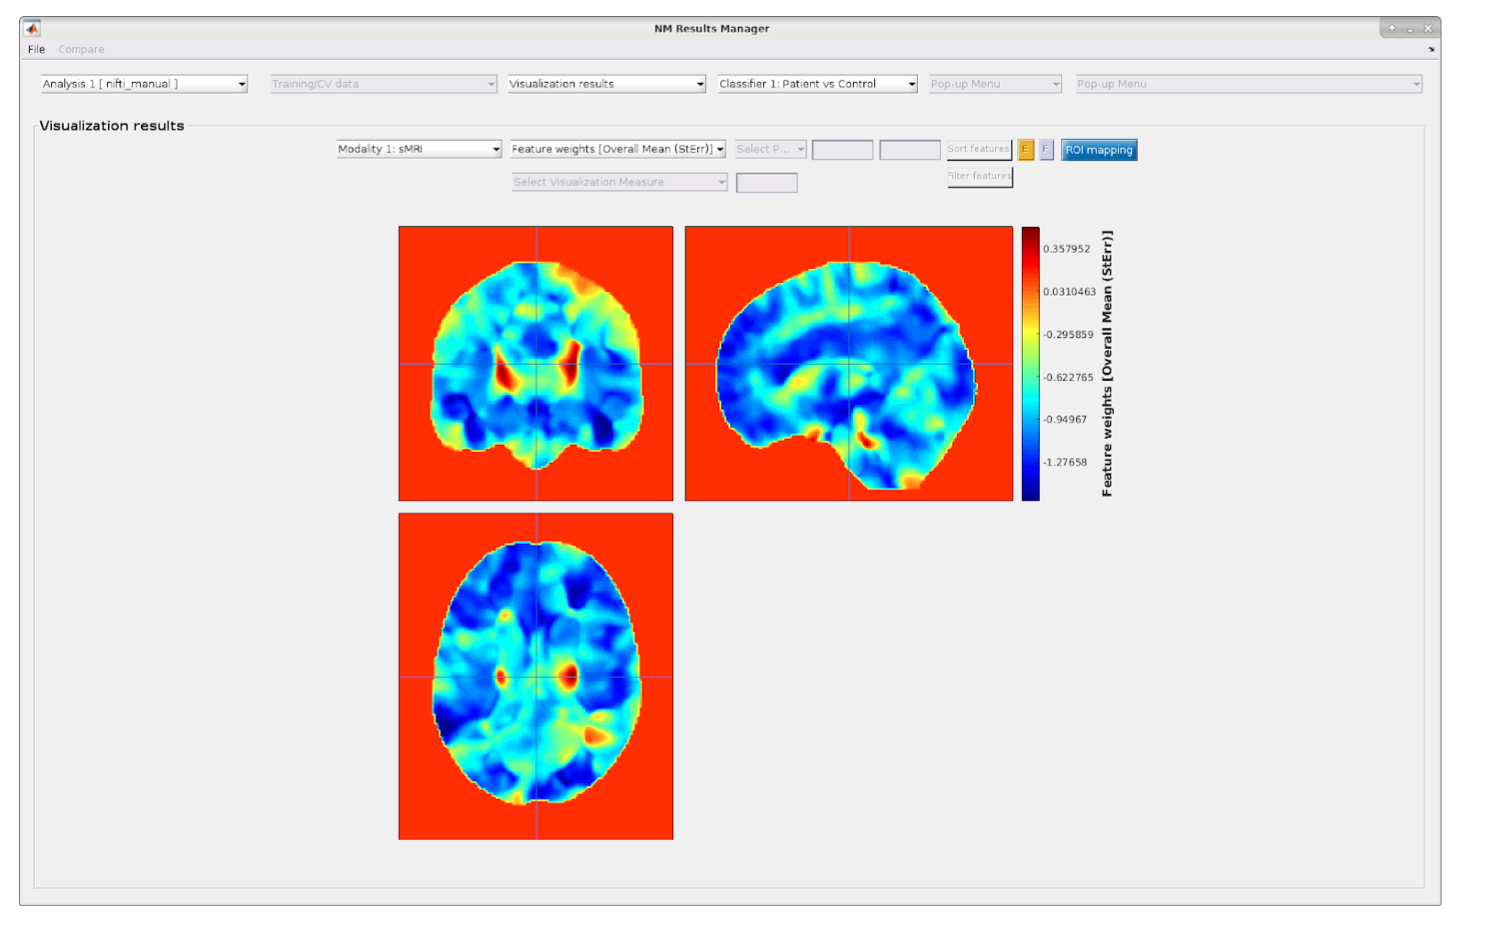
Fig. 28 Mean results with imaging data. Example of the depiction of the mean feature weights with standard errors for imaging data. A similar image is displayed for all other visualization parameters (i.e., CV-ratio, probability of feature reliability, sign-based consistency).#
ROI mapper#
For neuroimaging data, NM provides a functionality for mapping the result maps described above (e.g. cross-validation ratio, sign-based consistency) to regions of interest (ROI), as defined by a desired brain atlas. This can be especially useful for visually summarizing your results for a publication and ease of interpretation.
Note
This functionality is only available in MATLAB R2021b or above.
The ROI mapper can be accessed from the Visualization results window in the NeuroMiner Result Viewer by clicking on the blue button ROI mapping (see Fig. 28). This will open a separate window, as shown in Fig. 29. The window has two sub-menus in which you can set up the parameters for a two-step procedure: first analyzing and then plotting the ROI percentages occupied by the selected results map, thresholded accordingly.
Note
The plotting menu and active button will only appear once you run the analysis part (the mapping itself).
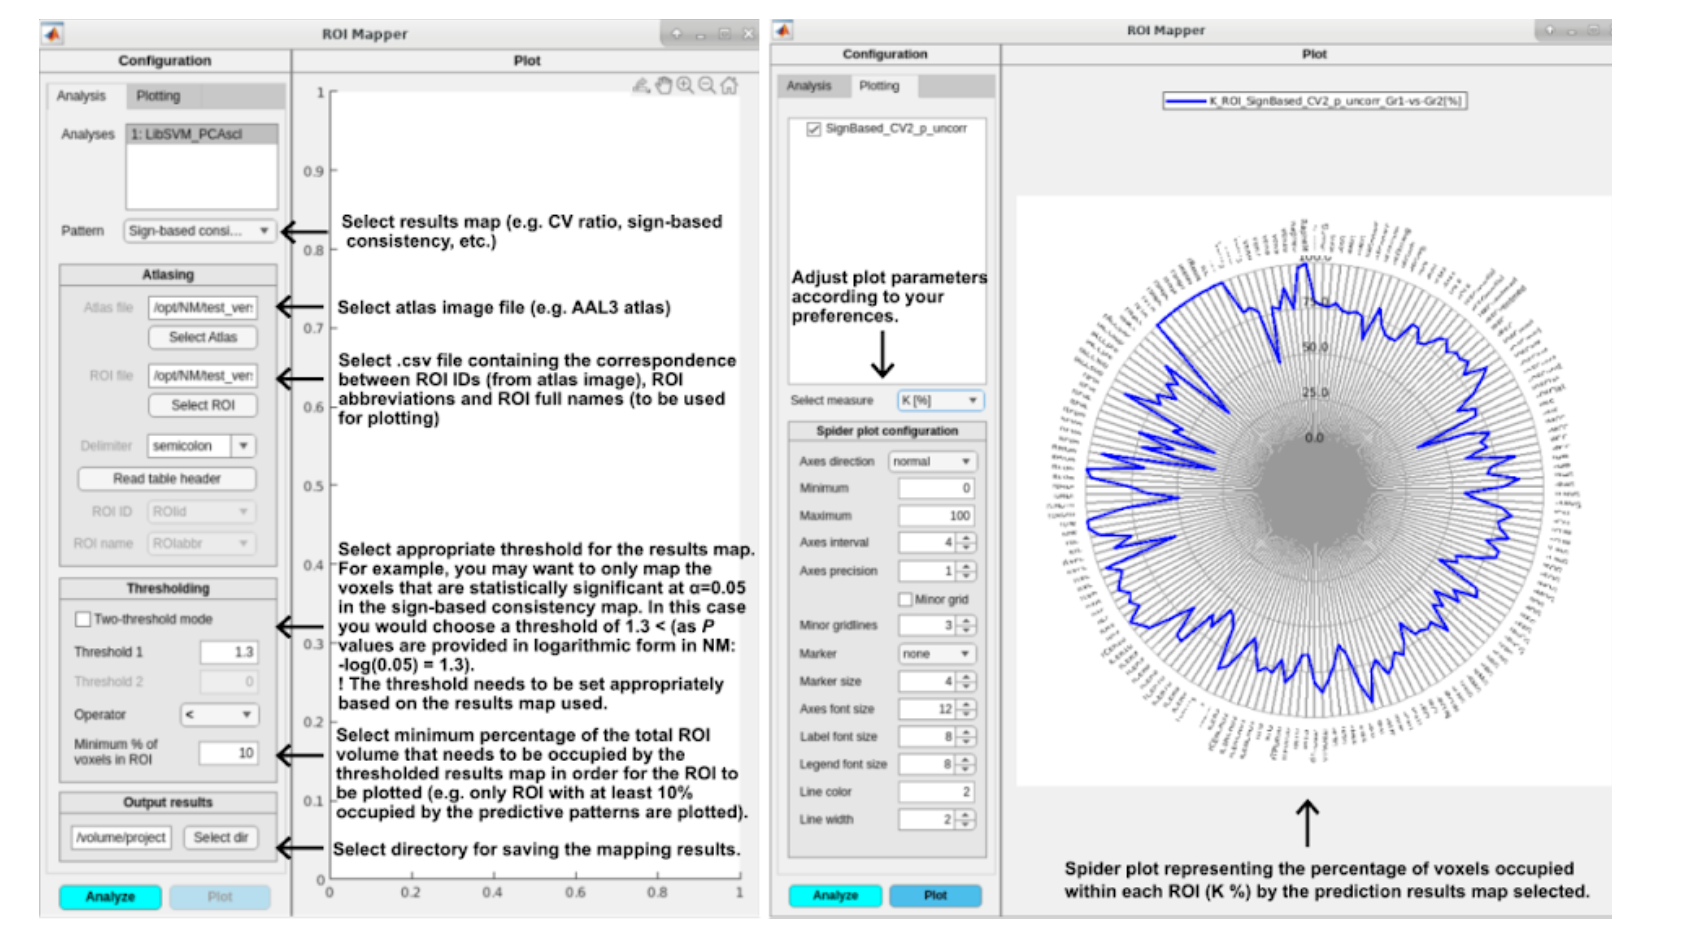
Fig. 29 ROI Mapper options for analyzing/mapping the results (left) and plotting (right).#
Overlay NIfTI Viewer (NM 1.4)#
The new overlay_nifti_gui.m replaces the old imaging viewer and supports:
2D slices (axial, coronal, sagittal) and 3D rendering
Neuroanatomical labels (atlas overlay) and ROI demarcation
Interactive thresholding and color‑map scaling
Batch export of figures
Component‑specific pattern analysis for DR models (Hungarian algorithm)#
For PCA/NMF/RPCA/PLS pipelines, components can shift across CV folds. NM 1.4 adds Hungarian‑algorithm matching to re‑order components against a template, enabling component‑wise pattern summaries and consistent visualization across folds.
FeatureRelevanceGUI (NM 1.4)#
A new FeatureRelevanceGUI lets you:
Plot a non‑imaging relevance metric for a given modality across multiple analyses, or compare modalities within a single early/intermediate‑fusion analysis.
Customize ordering (by magnitude, stability, alphabetical), bar coloring (separate positive/negative with separate palettes), and color scaling proportional to weight magnitude.
Export publication‑ready figures.
Open from Result Viewer → Visualization results → Feature Relevance.
Component matching across CV1 folds (NEW, NM 1.4)#
When reporting component‑wise maps, NM aligns columns so the j‑th slot tracks the same latent factor across resamples:
Prune zero/non‑finite columns and seed a reference per outer fold.
Compute similarities (default: Pearson) between current and reference columns.
Solve a Hungarian assignment with a minimum‑similarity threshold; unmatched slots remain NaN.
Sign‑correct matched columns to reference orientation.
Propagate alignment to component‑level p/q‑values, correlations, and (L_2) magnitudes (used by multi‑modal share plots).
Controls: similarity method/threshold; diagnostics: per‑component correlation to reference. For details, see Visualization Pathways.