(interprete_models)
ML Interpreter (MLI) results#
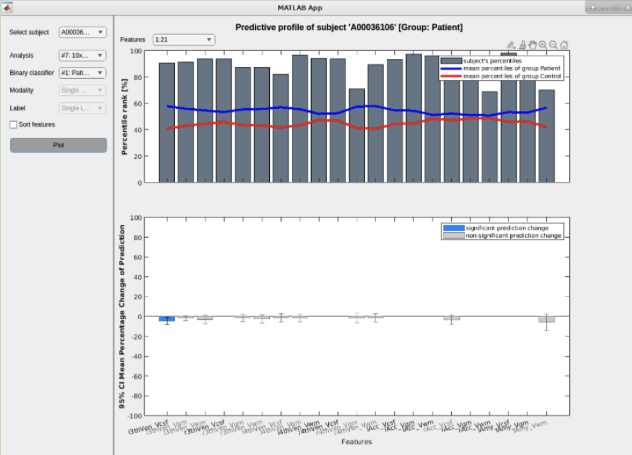
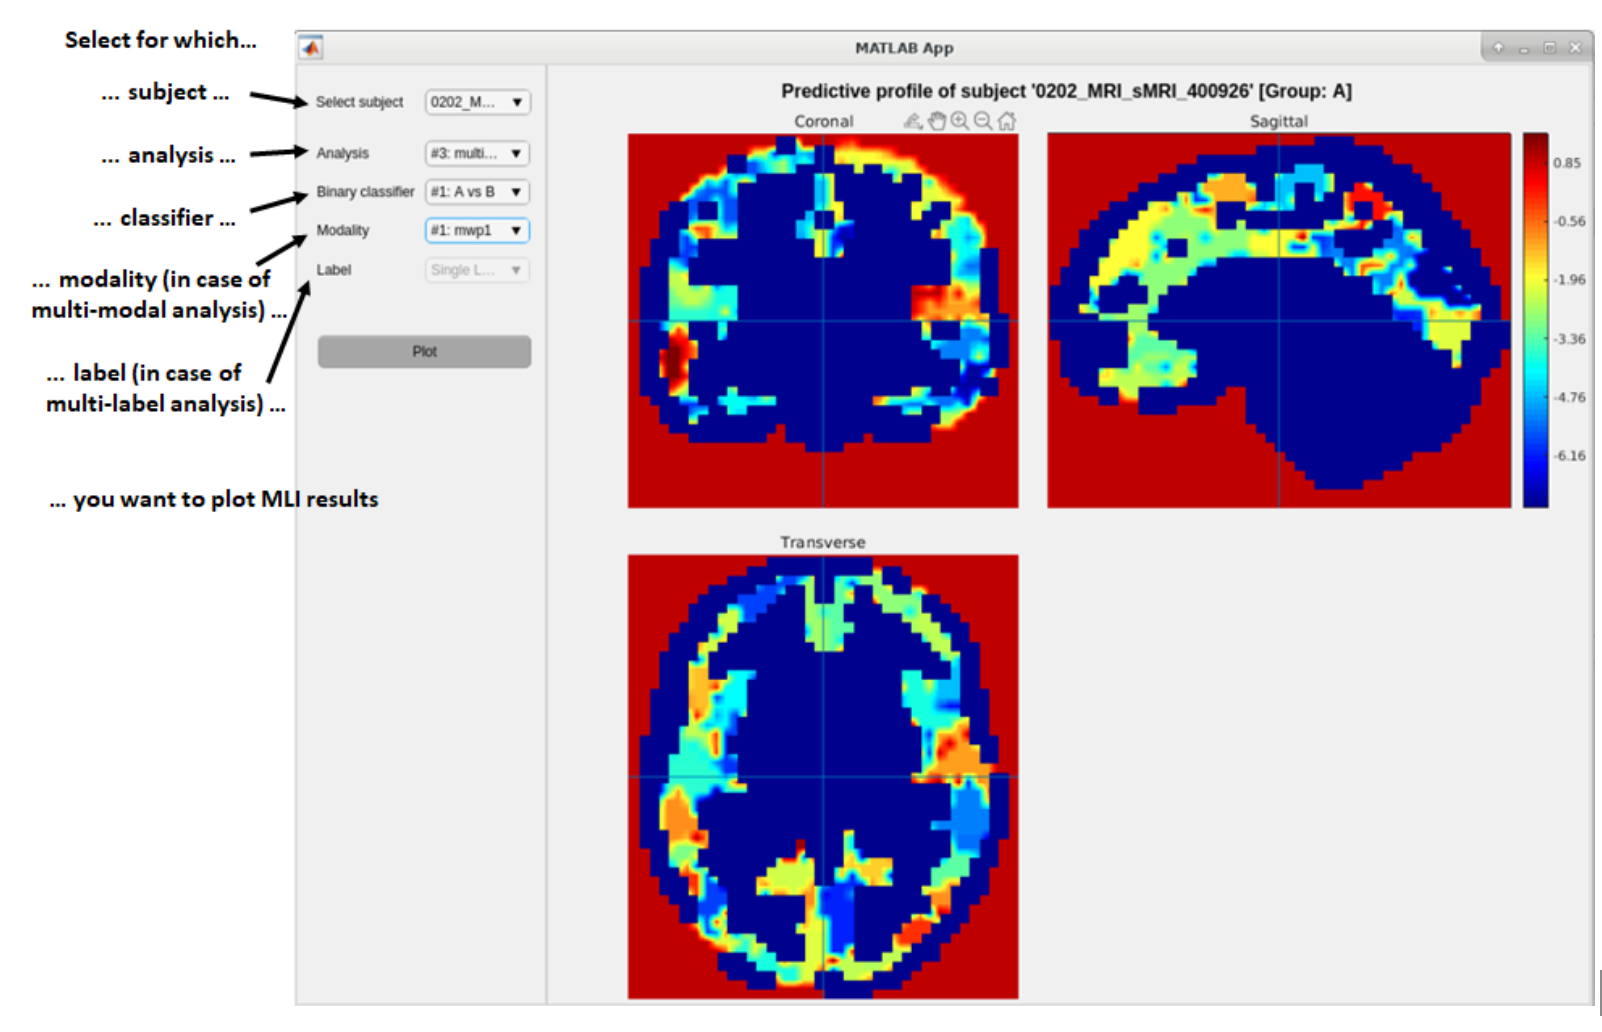
See Fig. 30 and Fig. 31: If the interpretation of predictions was run, the results can be viewed either by selecting ML Interpreter results from the plot drop down menu in the Results Viewer or by clicking on the blue button labeled I next to the classification plot (see Fig. 12). Both of these options will open the MLI Viewer.
Tip
You can also select a specific subject by clicking on its point in the classification plot before clicking the blue I button.‚

Fig. 30 ML Interpreter result viewer for matrix data#

Fig. 31 ML Interpreter result viewer for neuroimaging data#
The figure above shows the output of the occlusion-based interpretability for a predictive model, where the contribution of the different features to a subject’s prediction is assessed by systematically occluding the features and observing the change in prediction.
Top plot: Percentile rank of features#
The bars represent the percentile rank of each feature for the selected subject, showing how the feature’s value compares to the overall dataset.
The coloured lines show the mean percentile rank of each group (classification), providing a reference for comparison
Interpretation#
The subject’s feature values are compared to both groups. The percentile rank can be especially informative for occlusion methods that use sample statistics, such as occlusion by the median, extremes, medianflip, or medianmirror, as it helps quantify the extent of feature modification during occlusion.
Bottom plot: Percentile change in prediction#
This plot shows the average change in prediction when a feature is occluded (potentially together with other features depending on the defined fraction), with error bars representing the 95% confidence interval (CI) of the change. Significant prediction changes are indicated by blue bars, while non-significant changes are shown in gray. For Shapley, this plot visualizes Shapley values without any error bars and significance.
Interpretation#
Features with a significant prediction change when occluded are more influential for this subject’s individual prediction .
The direction of each feature’s contribution needs to be interpreted in context of the occlusion method, i.e. with respect to how each feature was modified during occlusion.
