Estimate sample size (simulation tool)#
NeuroMiner allows you to estimate the performance of models trained with simulated data. To open the simulation tool, select the option from the mainmenu.
Note
This feature only works with Matlab 2021b or newer.
The simulation tools runs in two modes: pre and post:
Pre-analysis simulation tool#
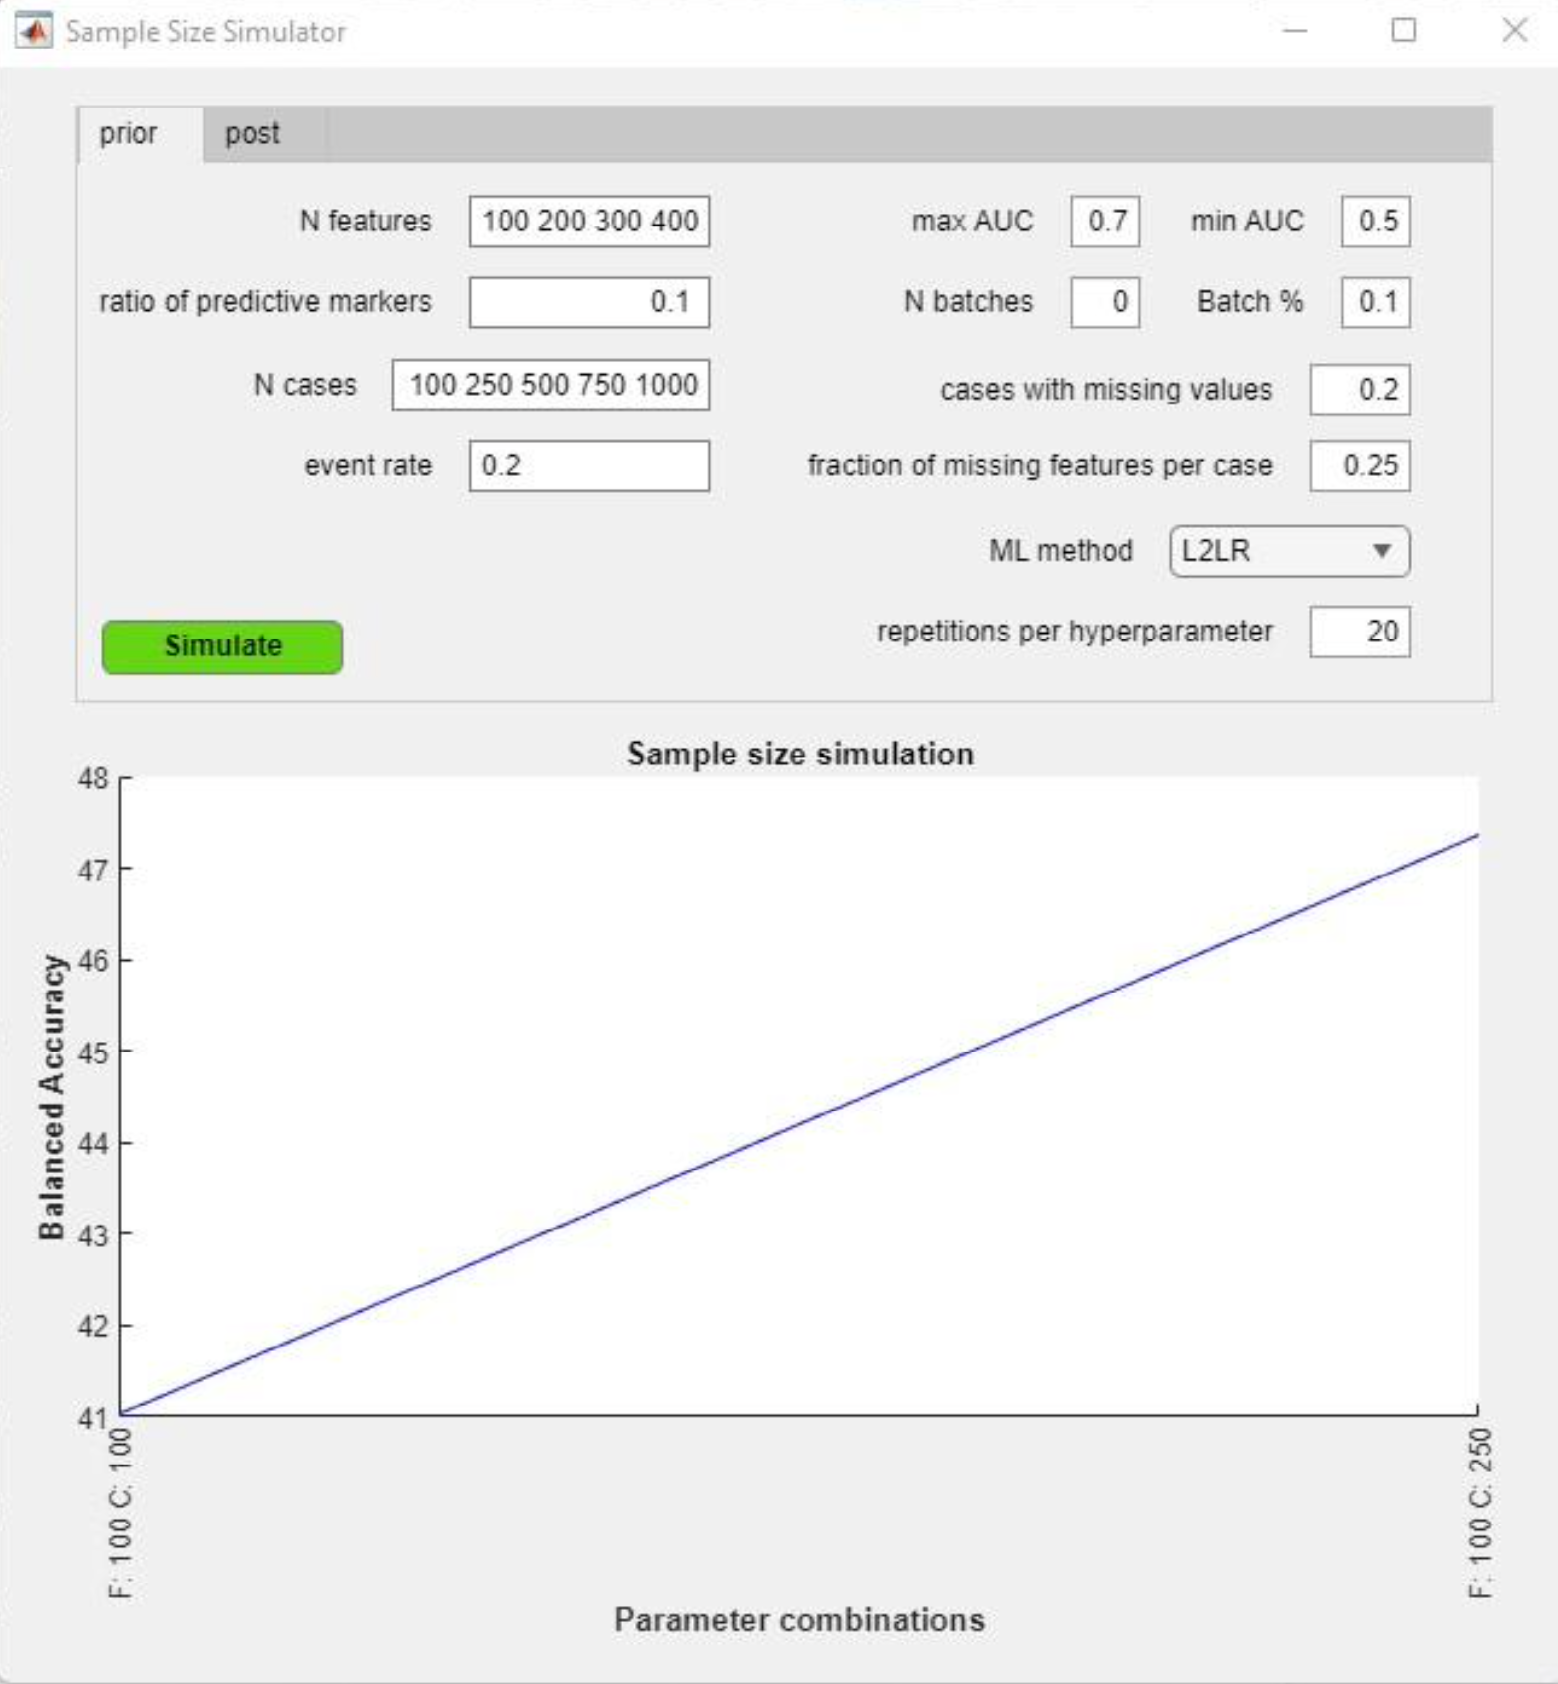
The pre-method generates synthetic data based on the user’s input and runs a simple classification pipeline on the data. The use can tweak a number of hyperparameters that determine how the synthetic will be generated:
N features: Absolute number of features to be generated
Ratio of predictive markers: the relative amount of features in the matrix that contain discriminative information
N cases: the absolute number of observations to be generated
Event rate: the proportion of observations labeled as group 1
If some or all of these 4 parameters are entered as ranges, the simulation tool will generate hyperparameter combinations and generate synthetic data for these combinations. Accordingly, the prediction analysis will be repeated for each of these combinations, and the learning curve of this analyses will be plotted in the simulation graph of the tool GUI:
Then, there are several static parameters that determine the generation of the synthetic data matrix:
max/min AUC: The separability induced by the predictive features in the matrix. NM uses an exponential decay function over these features spanning max to min AUC.
N batches: Number of batch effects to be added to the data. Batches simulate site/group effects and can therefore be used to estimate model performance e.g. in a multi-site setting.
Batch %: Fraction of the feature value range within which batch effects can be randomly introduced into the data matrix. Cases with missing values: Fraction of observations in the data matrix that contain missing values.
Fraction of missing features per case: Fraction of features values set randomly to “Not a Number” in those cases randomly selected to contain missings.
ML method: The user can select one algorithm from 5 different options to be used in the simulation analysis.
N repetitions: Number of repetitions of the analysis at given hyperparameter combination. Note: The “pre”-tool will run a nested 5-fold cross validation with one permutation at the outer and inner CV levels for each generated data matrix. The results of the pre-tool can be used to inform critical decisions during the planning of a prospective machine learning study, e.g. how many features to record, the targeted sample size, the number of sites to include, etc.
Post-analysis simulated tool#
In contrast, the “post-tool” evaluates the sample size requirements for an analysis with existing data. The user can use this tool to generate a learning curve for the given analysis pipeline (this includes the whole cross-validation pipeline, i.e., preprocessing + learning algorithm) by simulating new data from pre-existing data in NM by using a Gaussian copula function.
You can get to that tool by selecting the ‘post’ tab at the upper left side the GUI.
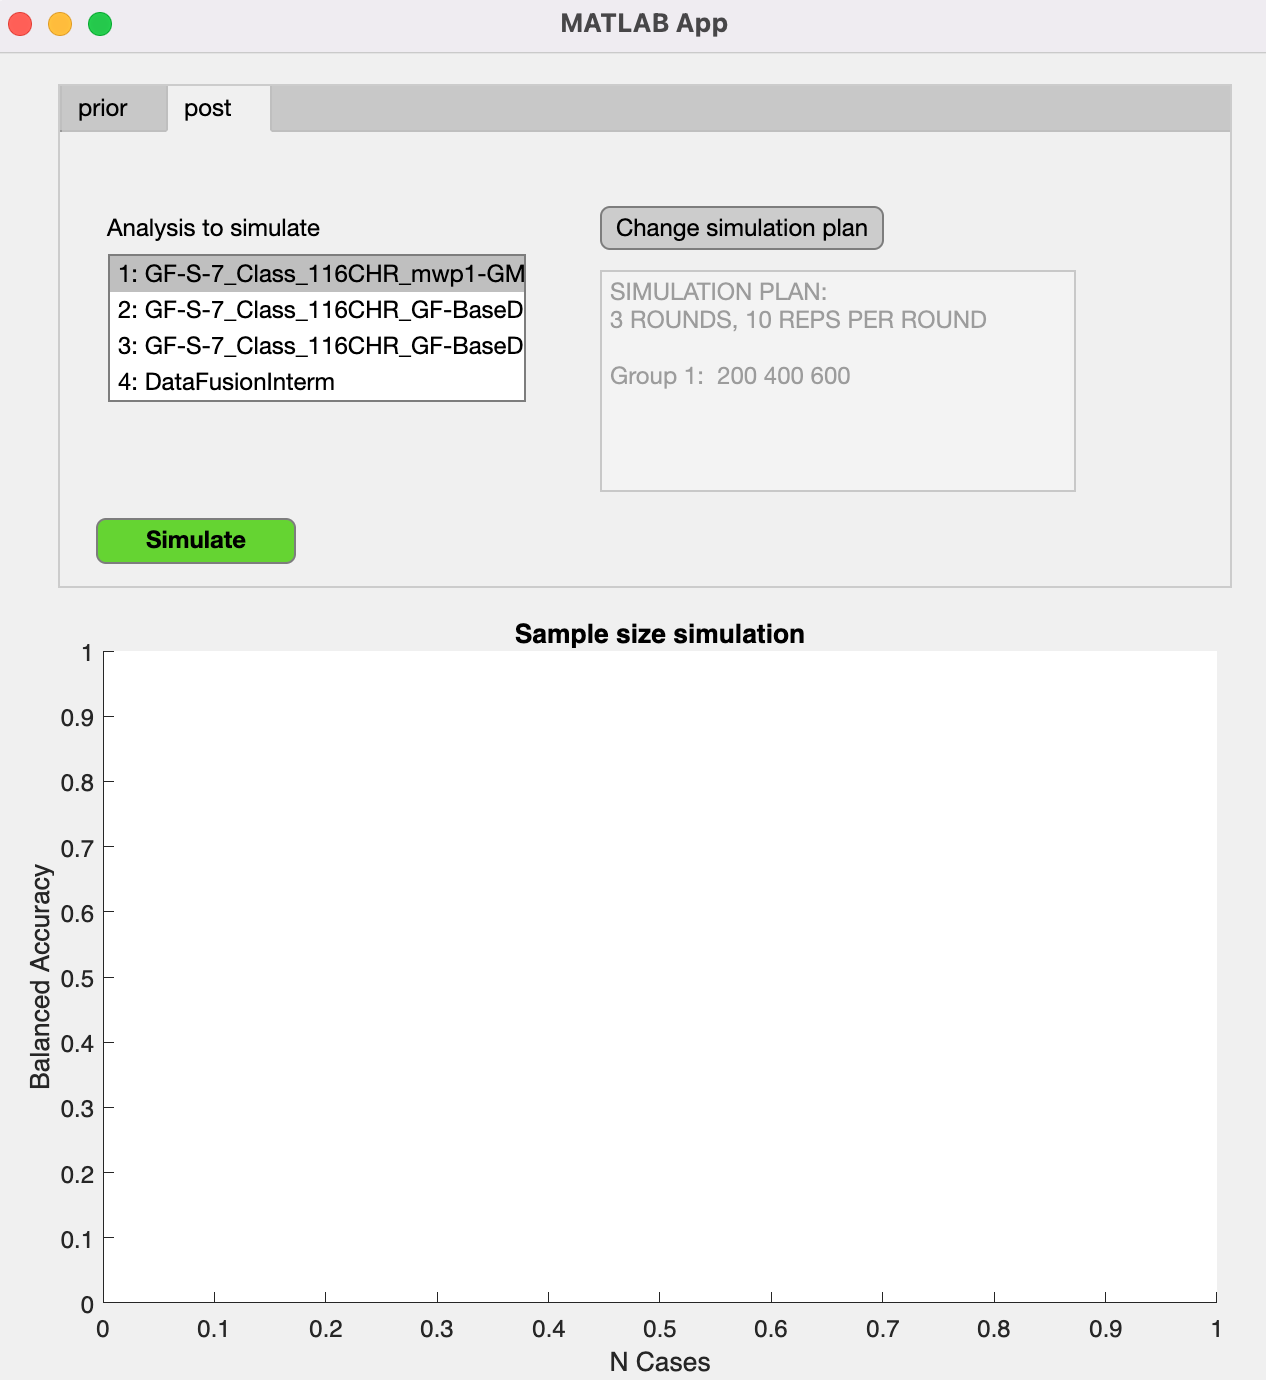
Select the analysis to simulate To select the analysis pipeline you want to simulate, select the analysis from the list on the left-hand side. The list box shows all initialized analyses of the NM structure. The data is simulated based on the original, ‘real’ data associated with the selected NM analysis using the Python sdv implementation of a Gaussian copula model.
Simulation plan setup#
By clicking the gray button Change simulation plan you open the setup window:
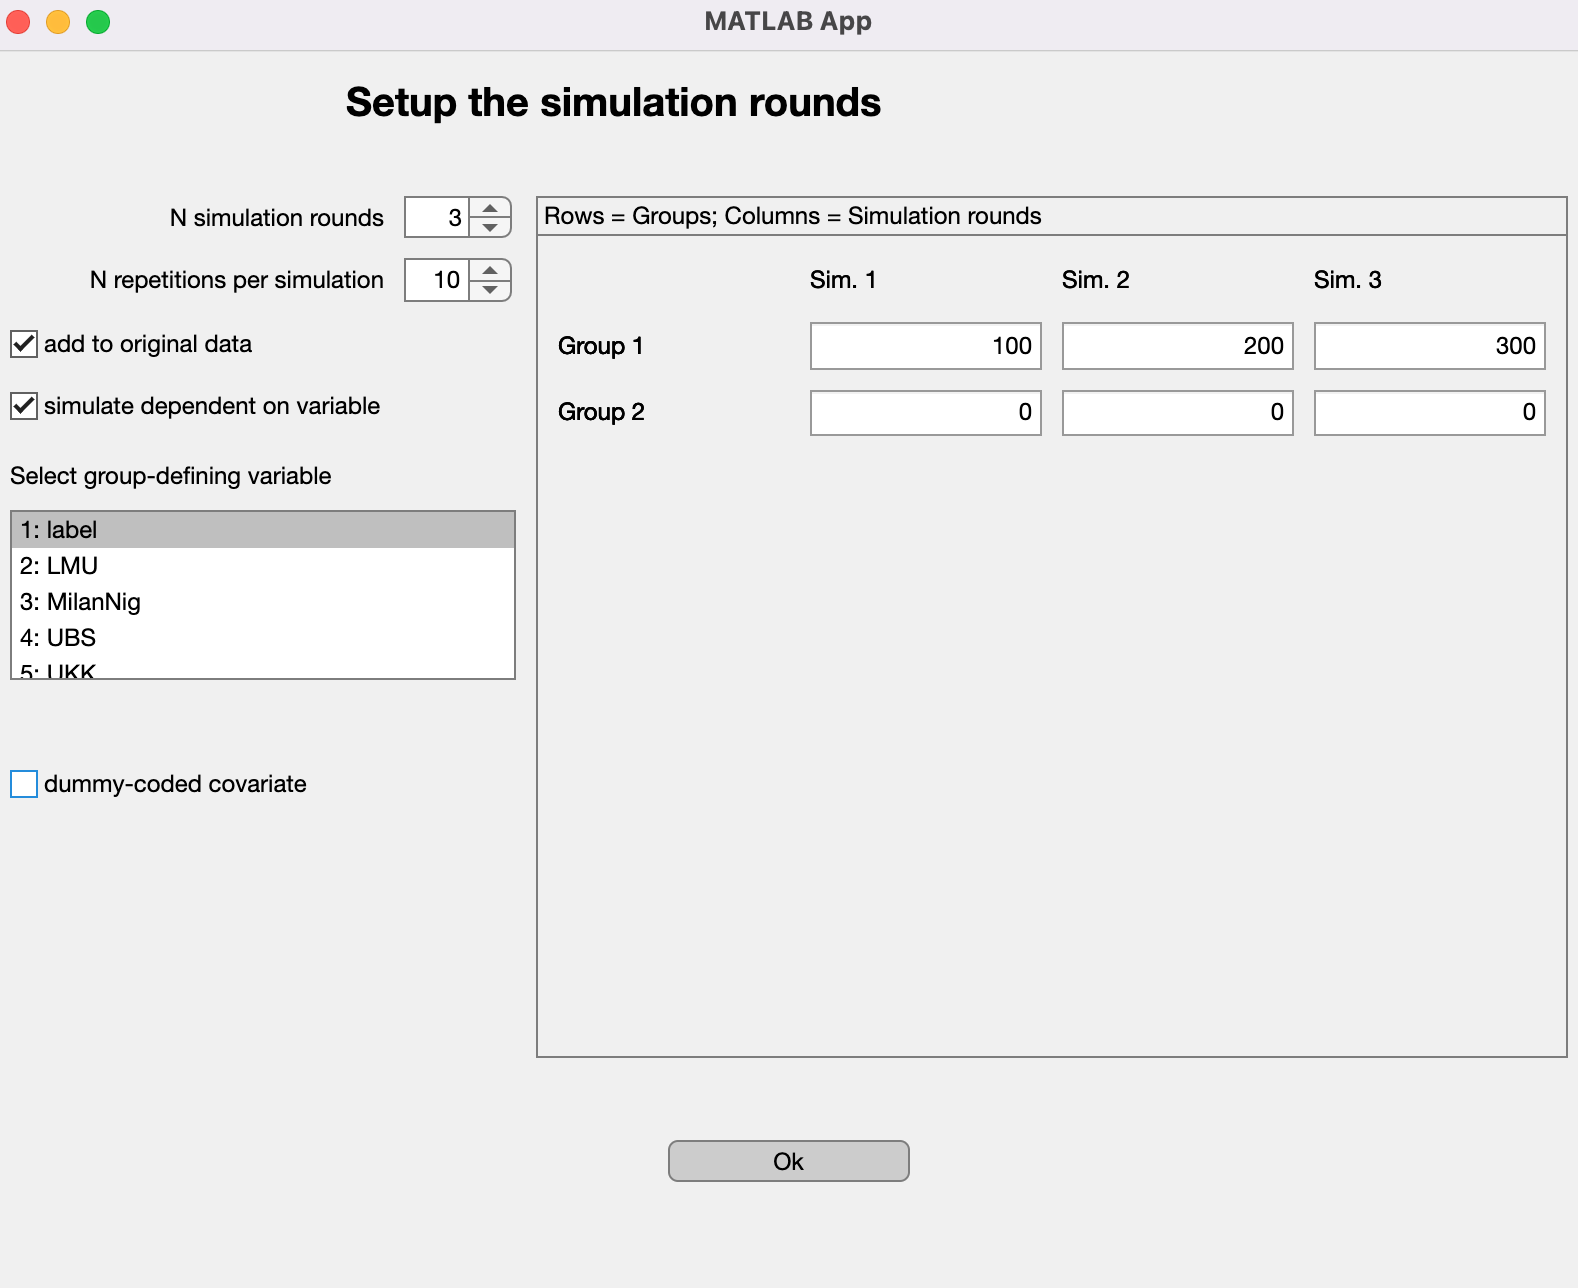
Fig. 30 NeuroMiner post-simulation setup window#
Here, you can specify how the data should be simulated. You can change the following settings:
N simulation rounds#
How many rounds of simulations do you want to run? You can specify the amount here. Simply click the arrows or type into the field.
The estimated performance per simulation round represents the mean of the repetitions.
N repetitions per simulation#
How often should each simulation round be repeated? You can specify the amount here. Simply click the arrows or type into the field.
Note
We recommend running repeated simulations to increase the stability of the performance estimations since the models are then trained on newly simulated data for each repetition.
Group-specific simulation#
By default, NeuroMiner assumes that you want to add data simulated across the whole original dataset. It is also possible, however, to simulate data dependent on a grouping variable, i.e. one of the covariates or, in the classification setting, the label. To activate this option, simply check the simulate dependent on variable check box on the left side. A list box will appear from which you can select the grouping variable.
Caution
Currently, NeuroMiner does not preselect those covariates that are categorical but simply shows all of them. Therefore, the user has to make sure to only select a categorical variable here. This is a known issue and we hope to fix it in future releases.
If you make use of the group-specific simulation option, you will see that a row for each group will appear in the panel on the right (as in Fig. 30).
Amount of data to simulate#
To specify how much data to simulate, type the requested number of simulated observations in the associated field in the panel on the right-hand side. There should be one field for each simulation round and each group.
Add simulated data to the original dataset#
By activating this option (by checking add to original data on the left-hand side), the models will be trained on the simulated data and the original dataset.
Dummy-coded covariates#
In case you read dummy-coded covariates intro NeuroMiner, you can indicate so by first checking the box next to dummy-coded covariate and then selecting the respective entries in the appearing list box. This ensures that during simulation, dummy-coding will be preserved, i.e. each simulated observation will only have a “1” in one of these variables (and “0” for the others).
Note
Currently, it is not possible to indicate dummy-coded feature variables but we hope to fix this issue in future releases.
Once you are happy with your simulation plan setup, click the ‘Ok’ button. The setup window will close and you will see a summary of the settings within the main simulation tool GUI. To start the simulation, click on the green ‘simulate’ button.
Note
Depending on your analysis pipeline, simulation plan and computational resources, the simulation can run for a (very) long time. Be aware of this!
You can follow the progress of the simulation by checking the plot within the GUI which will update once a new simualtion round (not repetition) starts.