Data entry in NeuroMiner#
NeuroMiner works with 3D neuroimaging (i.e., NIFTI, SPM, or FreeSurfer) and/or numerical data stored in matrices (e.g., Excel, csv, or MATLAB formats). For example, these are some of the data you can enter:
structural neuroimaging data (e.g., NIFTI files from an SPM study)
functional neuroimaging data (e.g., NIFTI files from 2nd level contrasts)
FreeSurfer data (e.g., thickness or gyrification)
clinical or cognitive data (e.g., in Excel)
genetics or other biological data (e.g., in csv)
functional connectivity matrices (e.g., in the MATLAB workspace)
DTI streamline matrices (e.g., in the MATLAB workspace)
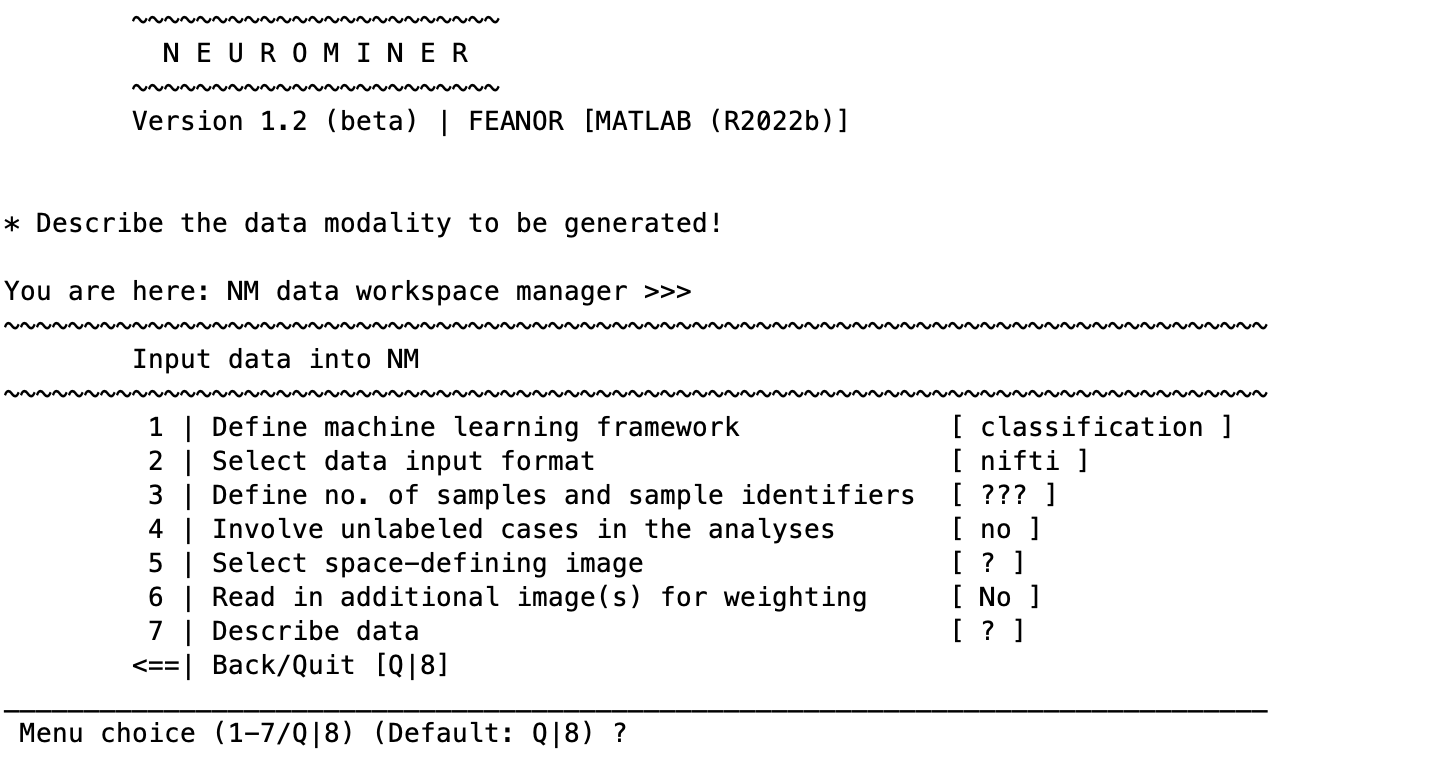
In NeuroMiner, each dataset is called a ’modality’ and multiple modalities can be entered at the same time to allow data fusion. For example, you can choose to perform machine learning on structural neuroimaging data alone or in combination with cognitive data. If data has not been entered and NeuroMiner does not detect a “NM” structure in the MATLAB workspace, then the user will be given the option to 1 | load data for model discovery and cross-validation. Selecting this option will transfer the user to the “NM data workspace manager”, which is an adaptive menu that changes based on selections, such as the machine learning framework or the data input format.
If no data has been selected the NeuroMiner menu will display a default menu that is configured for classification using NIFTI (neuroimaging) :
The machine learning framework can be changed to regression, which will modify some of the input entries that should be clear if the classification framework is understood (e.g., changing the group labels to a continuous measure). If you are in neuroimaging mode (i.e., if you have established paths for SPM and/or FreeSurfer), selecting the second option will change the menu to read:
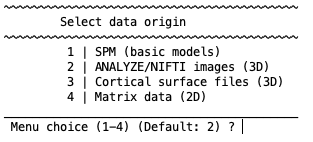
These data input format options will be described in more detail in the following sections.
Data input formats#
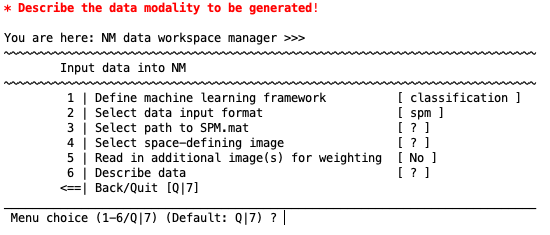
SPM.mat structure#
NeuroMiner gives the option of simply entering in an SPM.mat structure from a previous univariate analysis (e.g., t-tests, ANOVA, or regression). Each of the options in the following menu need to be selected:
Select path to SPM.mat#
A pop-up dialogue box will appear where you need to select the SPM.mat structure.
Select space-defining image#
Please see the description in the box ”Space-defining image” regarding selection of brain regions using the WFU PickAtlas
Read in additional image(s) for weighting#
This option gives you the opportunity to enter an image that will be used during preprocessing to weight the brain image features. It is specifically designed for when parcellated brain regions have been entered or when the WFU PickAtlas has been used to select brain parcels. In these cases, the image will consist of independent brain regions (e.g., the hippocampus, frontal lobe, cingulate cortex etc.). You can therefore enter a map of the same brain regions that have weights associated with each parcel based on the degree of importance of each region; e.g., 1 for the hippocampus, 2 for the frontal lobe, 3 for the cingulate. This weight map can then be used during preprocessing to up- or down-weight the features in the analysis (see Rank / Weight features).
Describe data#
Describe data Enter a description of the data. This is important if you are entering multiple modalities.
IMPORT#
Once the template is completed, you will be given the option to import the data into the NeuroMiner structure (“NM”) in the MATLAB workspace. The subject identifiers will be the unique fields in the paths to the files (e.g., the subject directory or filename).
Space-defining image
In NeuroMiner, a ”space-defining image” refers to an image that will define two things: 1) the voxel dimensions; and 2) the mask used to select the data. This means that all images will be resliced to the mask dimensions. NeuroMiner has two options for the mask: 1) Select a mask using WFU Pickatlas if it is installed in your SPM path; 2) your own space-defining image (e.g., the ICBM template). Within WFU PickAtlas, the default option is to write out a combined mask of selected brain regions. However, if the option ”write independent regions” is selected (checkbox, bottom-middle) then the regions will be written as separate data modalities into NeuroMiner. This means that different algorithms could be used on the different regions (e.g., one linear and one non-linear). Following selection of the mask, the user will be given the option to only include voxels above a mask threshold (e.g., in the case of a binary mask, more than 0). This will be reflected within an option called “Do you want to threshold the space-defining image?”. Setting the default options will allow the user to select for “Define threshold(s)”, “Define threshold mode” and “Define threshold operator”, which will set a threshold for the space-defining image. If a mask has been created using common default settings within SPM/FSL, then it will not be a completely binary mask and there will be a gradient between 0-1 at the boundary of the mask. This means that a common selection for thresholding is more than 0.5. When using WFU PickAtlas and writing independent regions, this option should not be selected. The brainmask will be stored so if further external validation analyses are conducted then the following users do not need to have the original brainmask.
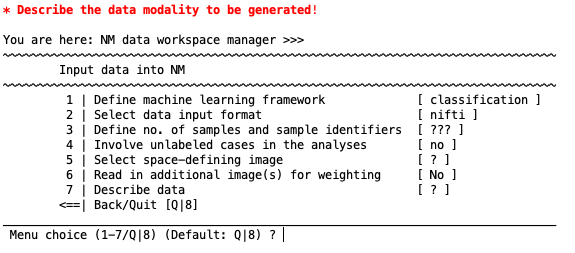
ANALYZE/NIFTI images#
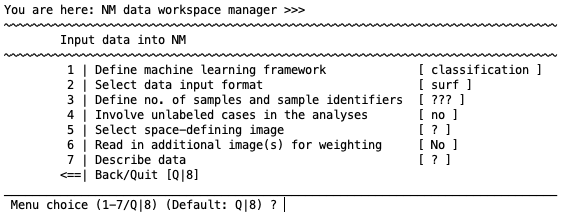
Analyze or nifti images can be selected here. Once this option is selected, the menu will change to the following:
Define no. of samples and sample identifiers#
Enter the number of groups (e.g., ”2”) and then enter descriptors for these groups (e.g., ”Patients” or ”Controls”). It is important to note that sensitivity will be defined as the correct classification of individuals in the first group entered, so this is usually patients in clinical studies.
Involve unlabeled cases in the analysis#
This gives the option to use cases that do not have a label for semi-supervised learning. Select space-defining image. Map image files to samples Use the pop-up SPM dialogue box to select the images for the samples together or for the groups separately. We recommend printing the absolute paths of the images in a text file and then use the ”ed” feature of the SPM dialogue box (bottom left) to paste the paths. You will be prompted to enter the groups one after the other.
Define global multiplier#
For each subject, multiply the voxel values by a numeric value.
Adjust data for globals#
This option is primarily for structural neuroimaging data where it is necessary to adjust the images for the global brain volume (e.g., whole-brain volume or intracranial volume). Either a vector is required in the MATLAB workspace or a text file is required. It is critical to note that the values must be in the same order as the images for your analysis – i.e., the participant order must match because there is no subject matching procedure. Inspect image information and check registration This option will allow the user to check the registration parameters to the template image and then display the images using the SPM check-reg function. This is useful to check whether the images are going to be imported properly.
Read in additional image(s) for weighting#
This option gives you the opportunity to enter an image that will be used during preprocessing to weight the brain image features. For example, when parcellated brain regions have been entered or when the WFU PickAtlas has been used to select brain parcels the image will consist of independent brain regions (e.g., the hippocampus, frontal lobe, cingulate cortex etc.). You can therefore enter a map of the same brain regions that have weights associated with each parcel based on the degree of importance of each region; e.g., 1 for the hippocampus, 2 for the frontal lobe, 3 for the cingulate. This weight map can then be used during preprocessing to up- or down-weight the features in the analysis (see Rank / Weight features). Alternatively, reliability coefficient images that are calculated during multi-site studies (e.g., with traveling subjects) can be entered here.
Describe data#
It is good scientific practice to describe your data here so that you know what you analyzed when you return to your analysis a couple of months later or want to combine the given data modality with others in the same NM structure.
IMPORT nifti#
After successful completion of these settings, an option for ’IMPORT nifti’ will appear. Selecting this option will import the nifti images into the NM structure based on the space-defining image that was selected and based on any correction for global brain volume. The subject identifiers will be the unique fields in the paths to the files (e.g., the subject directory or filename).
Cortical surface files#
This option is for FreeSurfer .mgz files. The menu items will change to be the same as the above for NIFTI files.
Please note that once NeuroMiner has finished processing, there is no utility currently to visualize the classifier results in the mgz format.
Matrix data: MATLAB workspace#
Matrix data is defined as any numeric data that is stored in a matrix file, such as an Excel file, CSV file, .mat file, or in the MATLAB workspace. The default menu is to enter variables from the MATLAB workspace as outlined in this section, but other choices can be made by selecting ”Define data provenance”. The following section will outline the options specific to entry of data from the MATLAB workspace.
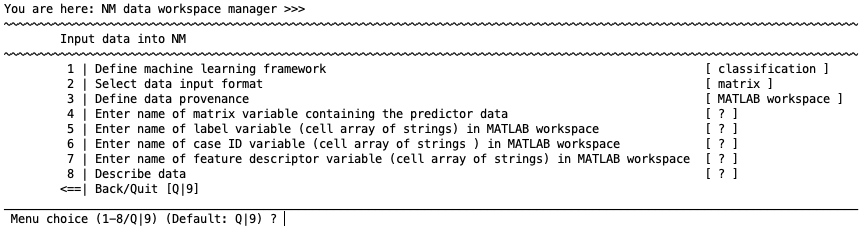
Enter name of matrix variable containing the predictor data.#
Enter the matrix containing the features (i.e., variables or predictors) that you want to use to predict the labels (i.e., the target or outcome variable). This variable must be a standard [n x m] MATLAB double (subjects = n; features = m). That is, the subjects must be entered row-wise and the features are column-wise.
Enter name of label variable (cell array of strings) in MATLAB workspace#
Labels are the targets of the prediction. For classification, these are group names or values (e.g., ”Control” and ”Patient”) and must be entered in a cell array of strings (see Box: Data types in NeuroMiner). We strongly discourage the use of numbers to represent groups (e.g., ”1” and ”2”) due to display and visualization later in processing.
Data types in NeuroMiner
There are two MATLAB data types used in NeuroMiner: standard double matrix and a cell array of strings. A standard double is what is created by default in MATLAB. A cell array of strings is when you have independent strings (e.g., char(’CTRL’)) stored in a cell string array (e.g., cellstr([’CTRL’;’PAT’])). A common situation is when you have a vector containing numbers representing groups of interest (e.g., groups = [1; 1; 2; 1; 2]). We strongly recommend changing this to have string variables representing the groups (i.e., ”CTRL” and ”PAT”).
Enter the name of case ID variable (cell array of strings) in MATLAB workspace#
Enter a vector with the case IDs of each subject. This must be a cell array of strings (see Box: Data Types in NeuroMiner).
Enter name of feature descriptor variable (cell array of strings) in MATLAB workspace#
Enter a vector with the names of the features. This must be a cell array of strings.
Inspect matrix data and select features for import#
Once the previous settings are entered, this option appears. It will open a results display where the data can be viewed as a heatmap, scaled, and features can be added or removed either by the user or they can be filtered based on a threshold (see Fig. 4). For example, after scaling features, you could establish a threshold where features with a scaled value above 0.8 are removed from the analysis. Alternatively, you might be concerned about the number of NaN (”Not a Number”) values being pruned or imputed in later analyses and so you could filter out the features with, for example, more than 25% missing values.
Note
The formatting of the item selector along with some functionalities might alter between MATLAB versions older than 2021a and more recent versions. This is due to incompatibilities of MATLAB’s App Designer with these older versions.
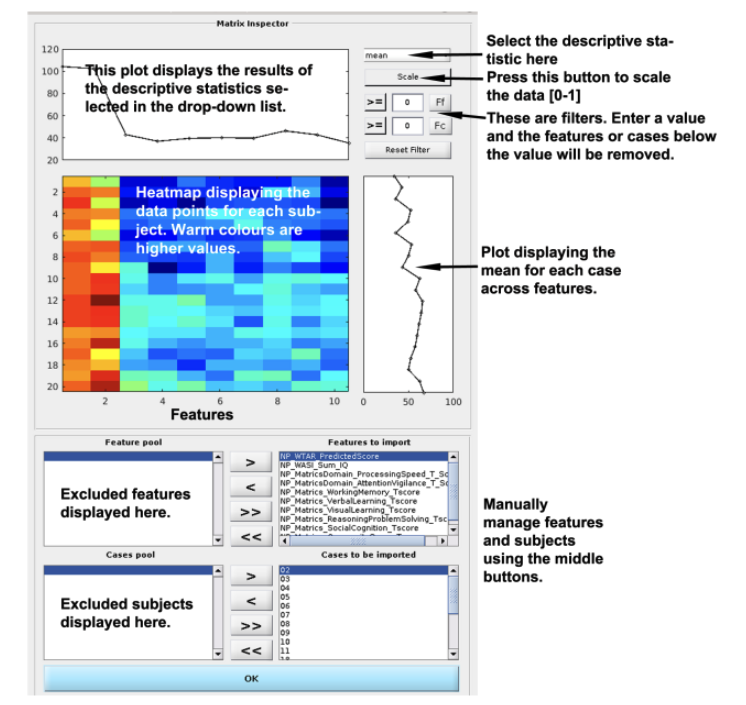
Fig. 4 Matrix Inspector. You can inspect the data in the matrix inspector to understand the data, identify errors, and exclude features or subjects. The descriptive statistics that can be displayed by using the drop-down list at the top right are the mean, median, variance, interquartile range, %(Nan) (i.e., ”Not a Number” missing values), kurtosis, or skewness. The data can also be scaled using the button underneath the drop-down list. Once a descriptive option is selected, you can then enter a filter to exclude either Ff(Feats) or Fc(Cases) based on a value. When a feature filter is used, a red line will appear that signifies the filter value and features above this value will be excluded and moved to the ”Feature pool” at the bottom left of the screen. You can manually add or subtract features or subjects using the arrows (>, <, >>, <<) between the feature pool and the features to import. Once features have been understood, filtered, or removed, press OK and return to the main menu.#
Describe data#
It is good scientific practice to describe your data here so that you know what you analyzed when you return to your analysis a couple of months later or want to combine the given data modality with others in the same NM structure.
IMPORT data#
This option will import data to the NeuroMiner structure (”NM”) and progress to the next screen.
Matrix data: from a .mat file#
This is the same as entering data from the workspace, but you can just select a pre-existing .mat file with all the variables. These are displayed at the top of the screen and then you can enter them using the directions above.
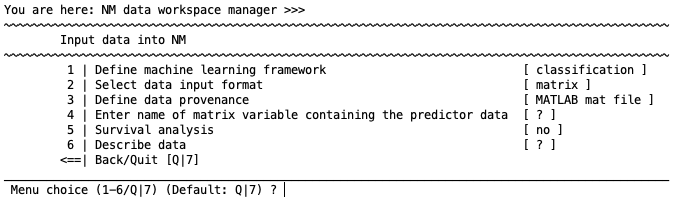
Fig. 5 NeuroMiner data entry menu for matrix data from .mat file#
Matrix data: from a text file#
The data can be stored in a .dat, .txt, or .csv file that has been saved with another program, such as Excel, R, or a database program. The file must contain labels for each of the IDs, labels, and features in the first row.
Important
In the classification context, the label variable must be string type.
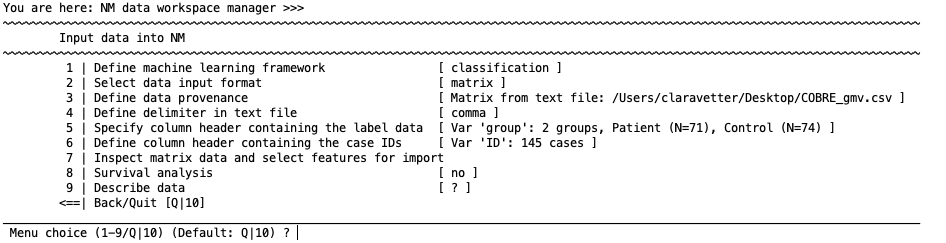
Define delimiter in text file#
Define the delimiter that was used to generate the file (i.e., comma, tab, etc.). It is critical to use the correct delimiter.
Specify column header containing the label data#
Write the column header variable name for the label data in your CSV file; e.g., ”Illness” or ”PANSS General”. For classification, the variable must consist of strings instead of numerical coding in case of classification (i.e., must be ’CTRL’ and ’SCZ’ instead of numbers representing these groups). It has to be numeric values in the regression mode.
Define column header containing the case IDs#
Write name of the column header variable name for the case IDs in your CSV file; e.g., ”ID”.
Inspect matrix data and select features for import#
This feature opens a results display where the data can be viewed as a heatmap, scaled, and features can be added or removed either by the user or they can be filtered based on a threshold (see Figure 4). For example, after scaling features, you could establish a threshold where features with a scaled value above 0.8 are removed from the analysis or features that, for example, have more than 25% NaN (”Not a Number”) features are removed.
Note
The formatting of the item selector along with some functionalities might alter between MATLAB versions older than 2021a and more recent versions. This is due to incompatibilities of MATLAB’s App Designer with these older versions.
Describe data#
It is good scientific practice to describe your data here so that you know what you analyzed when you return to your analysis a couple of months later or want to combine the given data modality with others in the same NM structure.
IMPORT data#
IMPORT data This option will import the entered data to the NeuroMiner structure (”NM”).
Matrix data: from a spreadsheet#
This option will import data from a spreadsheet (only xls and xlsx). As with CSV files, the file must contain variable names (of type ‘Text’ or ‘General’) containing IDs, labels, and features in the first row.
Important
Continuous variables must be of type ‘Number’ (i.e., aligned with the right side of the box in Excel). Sometimes it can happen that the formatting of decimal numbers (dot or comma) is not recognized by your settings, in these cases the values would be aligned to the left of the box even when changing their type to ‘Number’. One way to fix this, is to reformat the numbers by replacing dot with comma or vica verca. If continuous variables are not of type ‘Number’, NeuroMiner will not recognize them as such but as categorical which can cause errors.
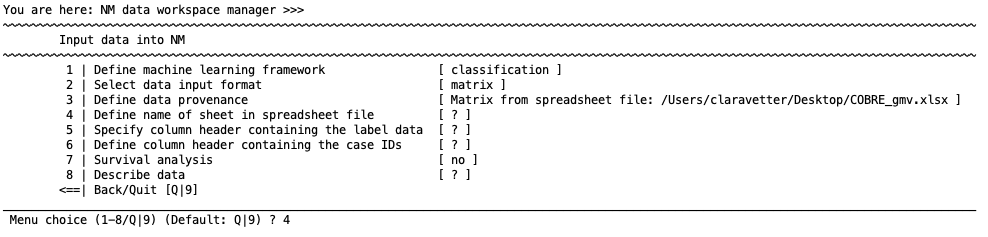
Define name of sheet in spreadsheet file#
Choose the sheet that you want to import.
Specify column header containing the label data#
Write the column header variable name for the label data in your spreadsheet file; e.g., ”Illness” or ”PANSS-General”. For classification, the variable must be string variables instead of numerical coding (i.e., must be ’CTRL’ and ’SCZ’ instead of numbers representing these groups).
Define column header containing the case IDs#
Write name of the column header variable name for the case IDs in your spreadsheet file; e.g., ”ID”. These must be string variables (i.e., ’ID123’ instead of 123).
Specify maximum # of unique values in non-numeric variables for dummy-coding#
This menu item only appears if NM detected string values in your predictor matrix. In this case the software assumes that the given variable is categorical and will try to expand it into a binary matrix of dummy regressors. Here you can define the maximum number of unique values per string column for this operation. If NM encounters more unique entries an error will be thrown, indicating potential problems with your data matrix (e.g. accidental string values such as . or , in an otherwise numeric variable). In general, it is highly recommended to carefully check your spreadsheet data before entering into NM.
Inspect matrix data and select features for import#
This feature opens a results display where the data can be viewed as a heatmap, scaled, and features can be added or removed either by the user or they can be filtered based on a threshold (see Figure 4). For example, after scaling features, you could establish a threshold where features with a scaled value above 0.8 are removed from the analysis.
Note
The formatting of the item selector along with some functionalities might alter between MATLAB versions older than 2021a and more recent versions. This is due to incompatibilities of MATLAB’s App Designer with these older versions.
Survival analysis#
This menu item enables the user to provide censoring information in case of a longitudinal analysis. If survival analysis is activated, an adaptive version of the Cox proportional hazards models can be selected from the algorithm list (see Koutsouleris et al. 2021).
Describe data#
It is good scientific practice to describe your data here so that you know what you analyzed when you return to your analysis a couple of months later or want to combine the given data modality with others in the same NM structure.
IMPORT data#
IMPORT data This option will import the entered data to the NeuroMiner structure (”NM”).
Add a Modality, Add Covariates, and Finish Analysis#
Once data has been imported, you will be taken to the NM data workspace manager. Above the menu, you’ll see a section called ”MODALITIES” that will display the modality that has been entered and some descriptive statistics (e.g., the dimensionality and the number of NaN (’Not a Number’) missing features). The menu will display the following:
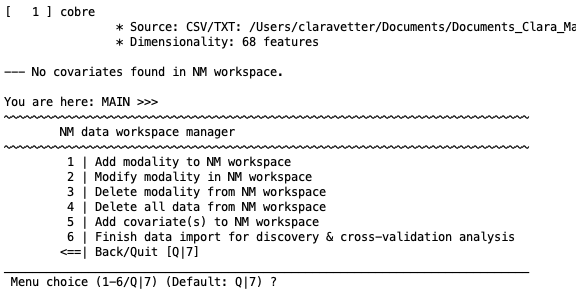
1 | Add modality to NM workspace#
This option gives you the ability to add another dataset to the workspace for later data fusion or stacked generalization. It can be another modality (e.g., matrix data and then neuroimaging data) or the same modality (e.g., structural neuroimaging data of one type and then of another type). The user will then be presented with the options that have been described above to repeat the process of data entry for another modality.
Important
It is critical to note that the subject identifiers have to be the same for each modality. In the case of NIfTI or SPM import, NeuroMiner will identify the subject IDs from the unique data in the file paths and thus any other data needs to have the same subject IDs (e.g., matrix data).
Tip
If you want to combine imaging data with other modalities it is highly recommended to read in the imaging data first. Then, use the identifiers in the variable ‘NM.cases’ to replace the IDs of your sample in the other data modalities (example: spreadsheets) before attempting to import these additional data modalities.
2 | Modify modality in NM workspace#
This option takes you back to the ”Input data into NM screen” where you can modify the settings or data described above.
3 | Delete modality from NM workspace#
Delete a modality that has been entered.
4 | Delete all data from NM workspace#
Delete all data and start again.
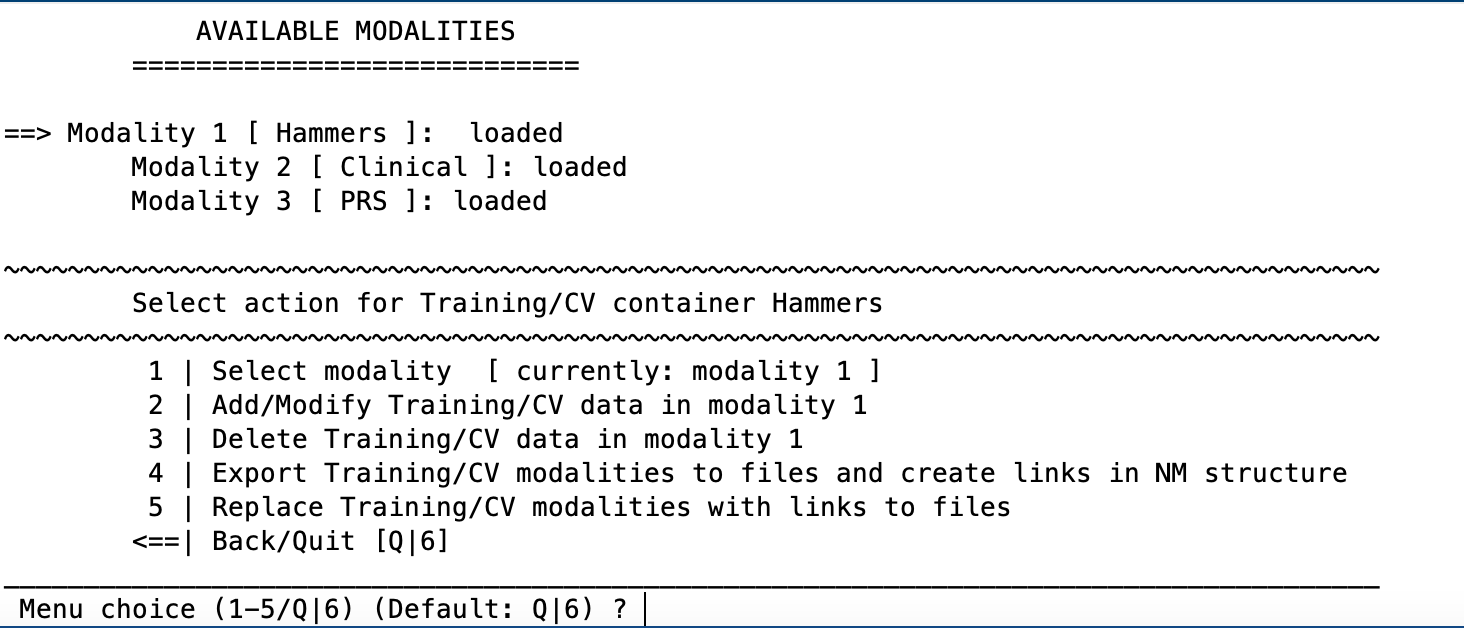
5 | Open NM Modality Manager#
Check which modalities you’ve loaded, export them to files on disk and create links to these files (to reduce size of NM structure) or replace them.
6 | Add covariate(s) to NM workspace#
This is a critical feature of NeuroMiner that allows the entry of matrix data that can be used in later preprocessing steps to control for nuisance covariance (e.g., age and sex). It is critical to note that this step simply enters the data and does not actually regress out the effects of the variables from your data. However, these data can be used to correct data for nuisance covariates later in the preprocessing steps (see section 4.2.3.3).
Please also note that if you want to normalize the data to a specific group (see section 4.2.3.7), a binary vector (i.e., zeros and ones) must be entered at this stage containing ones for the individuals in the group that you want to normalize to.
Important
The covariates must be stored in the MATLAB workspace – i.e., they must be loaded prior to starting NeuroMiner. They also must be a standard matrix of doubles containing subjects in rows and covariates in columns. It is critical to note that the subjects must be in the same order as the other data that has been entered, regardless of what that data was. This is especially important if you are using an automatic method of selecting files for NIfTI images.
After the entry of the MATLAB matrix name, the variables’ names can be defined one by-one or by using a vector. The covariate names will then be displayed in the ”MODALITIES” section at the top of the screen.
7 | Delete covariate(s) from NM workspace#
Once covariates have been added, this option will pop up in the menu. Select “6” if you want to delete the covariates from the workspace.
7/8 | Finish data import for discovery & cross-validation#
This option will finish the data import section. It is important to note that once this is selected you will no longer be able to modify any part of the data, including the addition of other modalities, covariates, or anything else. If there are changes, then you will need to enter the data again. Once the data has been processed, the user can however test models by entering out-of-sample data (e.g., external data from another center or group).