Visualization results#
See Fig. 21 to Fig. 24: As described in visualization, various graphs or maps are displayed if the visualization has been run and can be viewed when selecting Visualization results in the drop-down menu.
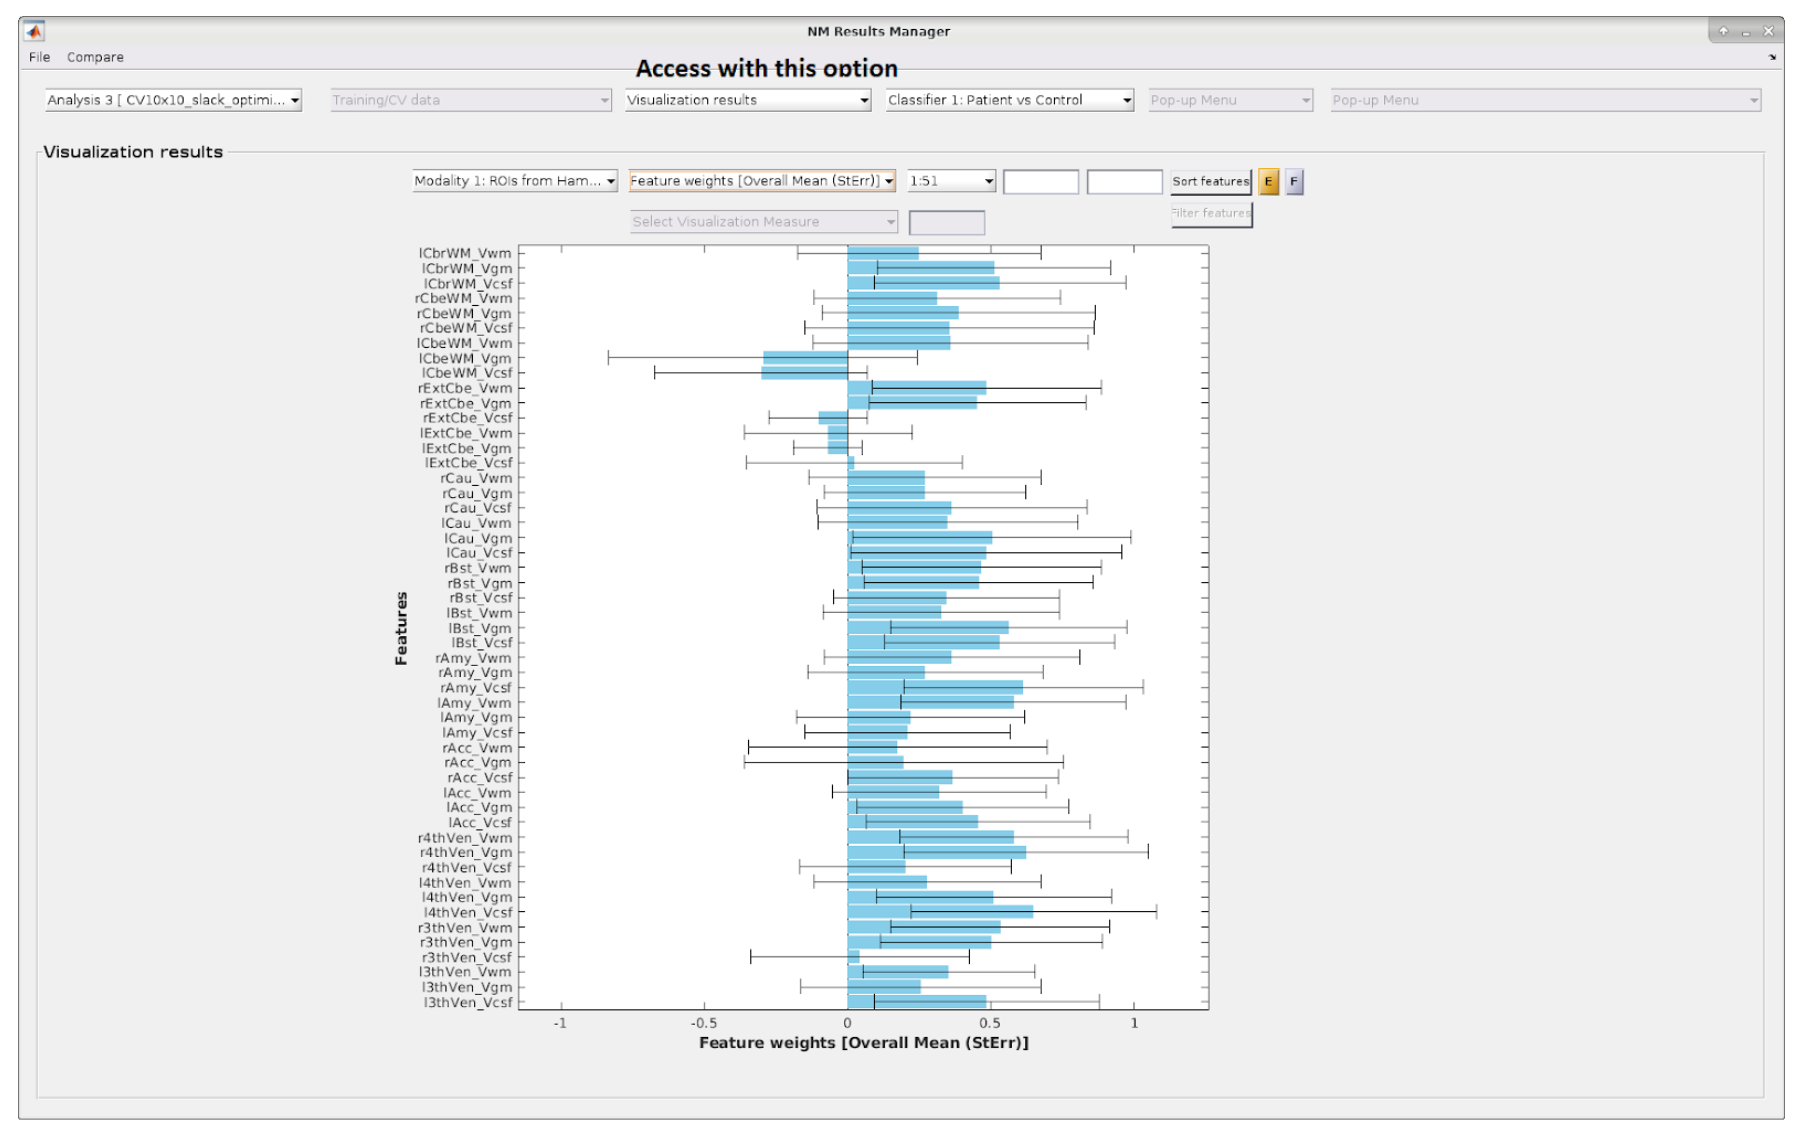
Fig. 21 Overall mean results including standard errors with matrix data. A similar image is displayed for the grand mean results.#
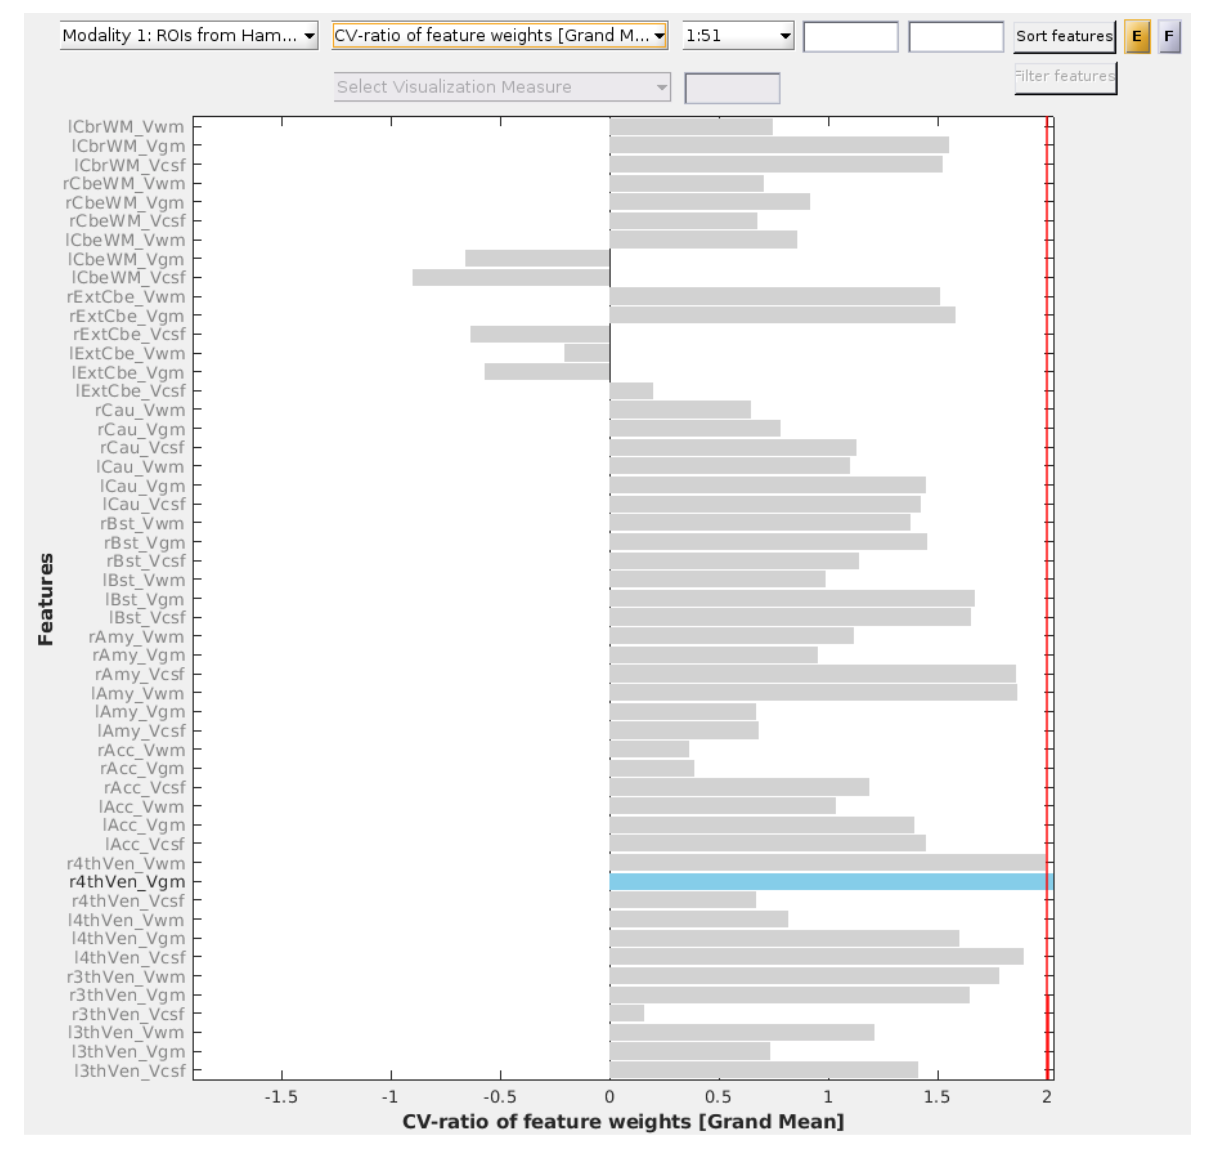
Fig. 22 CV-ratio of feature weights with matrix data.#
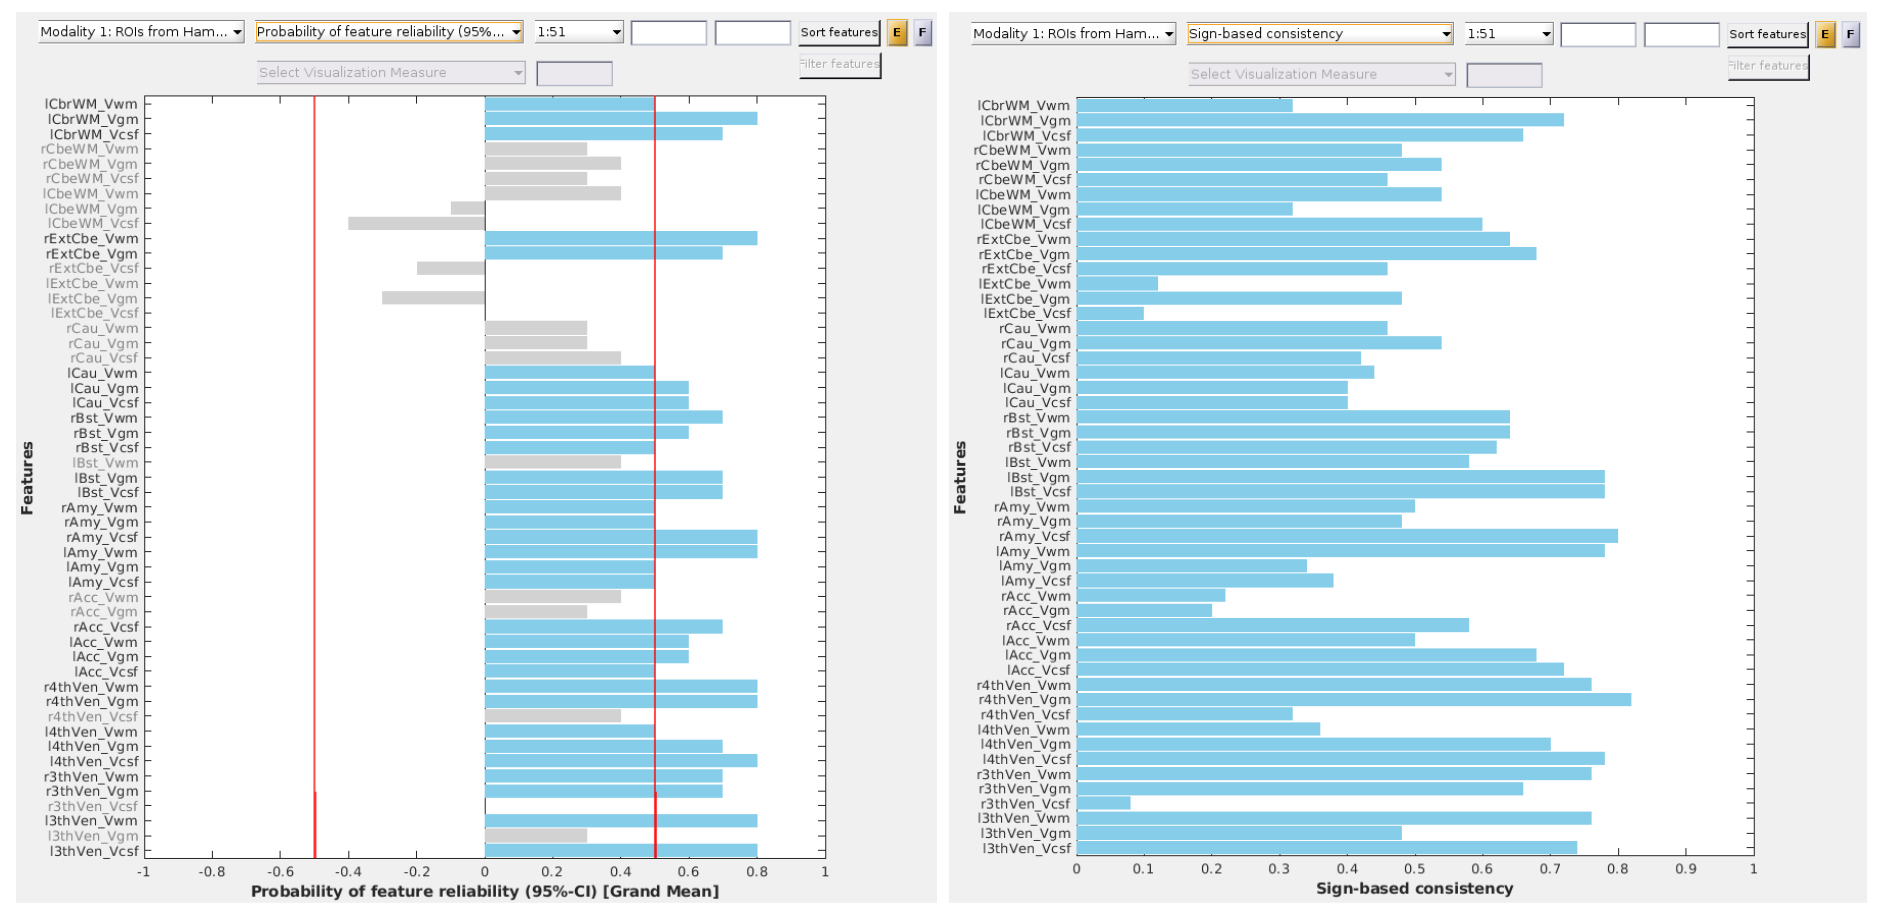
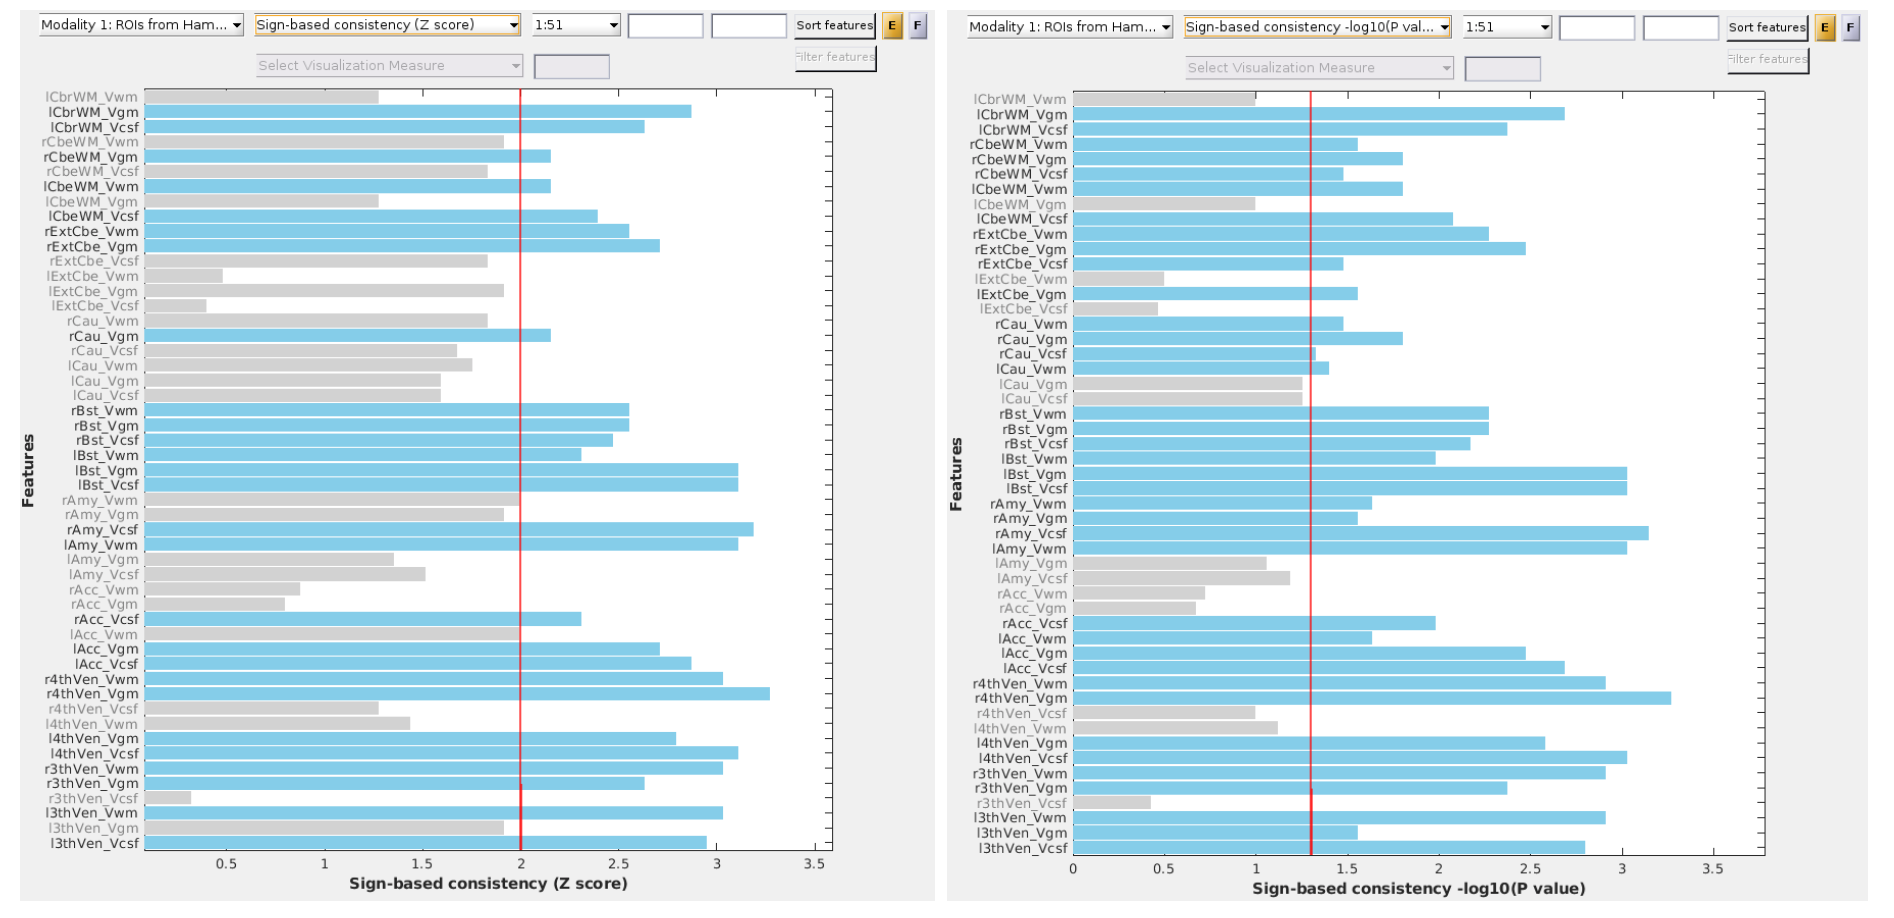
Fig. 23 Probability of feature reliability (upper left), sign-based-consistency (upper right), sign-based consistency - Z score (lower left), sign-based consistency -log10 - P value (lower right) with matrix data.#
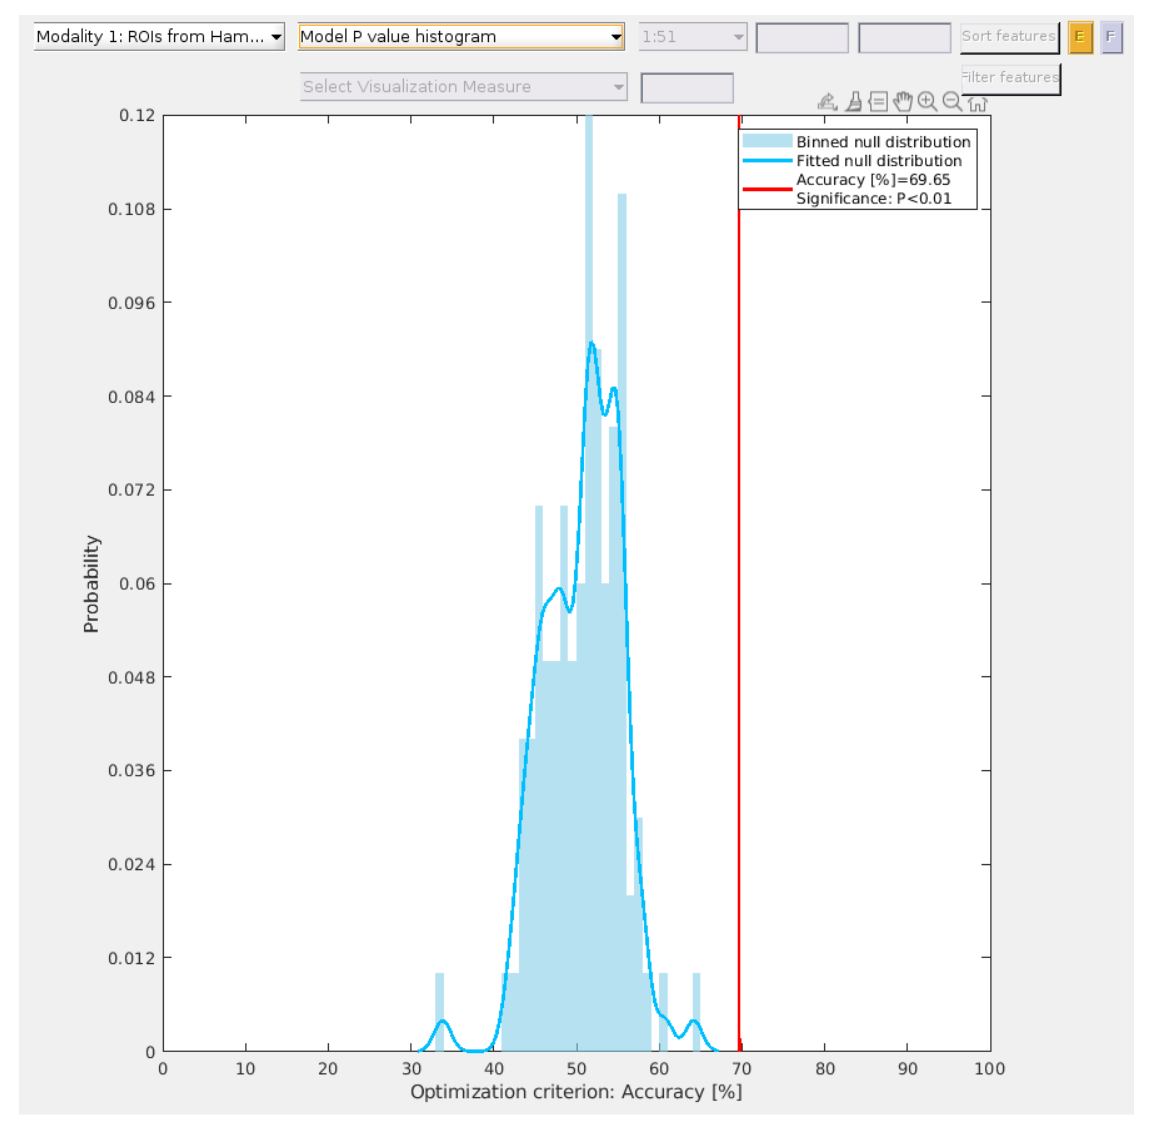
Fig. 24 Histogram of the p-values derived from permutation testing.#
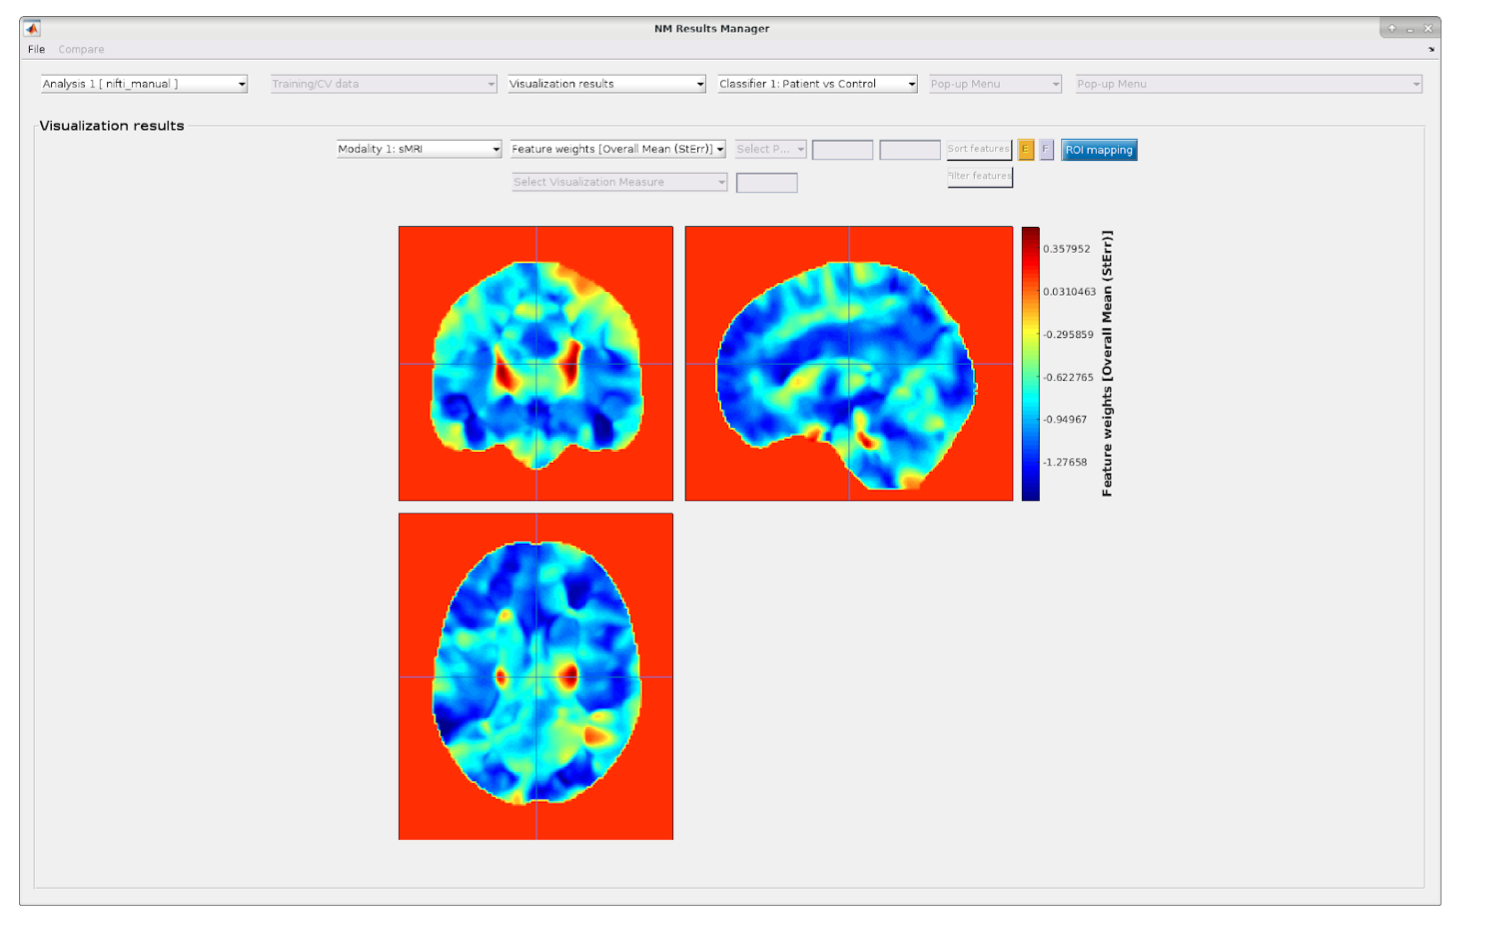
Fig. 25 Mean results with imaging data. Example of the depiction of the mean feature weights with standard errors for imaging data. A similar image is displayed for all other visualization parameters (i.e., CV-ratio, probability of feature reliability, sign-based consistency).#
ROI mapper#
For neuroimaging data, NM provides a functionality for mapping the result maps described above (e.g. cross-validation ratio, sign-based consistency) to regions of interest (ROI), as defined by a desired brain atlas. This can be especially useful for visually summarizing your results for a publication and ease of interpretation.
Note
This functionality is only available in MATLAB R2021b or above.
The ROI mapper can be accessed from the Visualization results window in the NeuroMiner Result Viewer by clicking on the blue button ROI mapping (see Fig. 25). This will open a separate window, as shown in Fig. 26. The window has two sub-menus in which you can set up the parameters for a two-step procedure: first analyzing and then plotting the ROI percentages occupied by the selected results map, thresholded accordingly.
Note
The plotting menu and active button will only appear once you run the analysis part (the mapping itself).
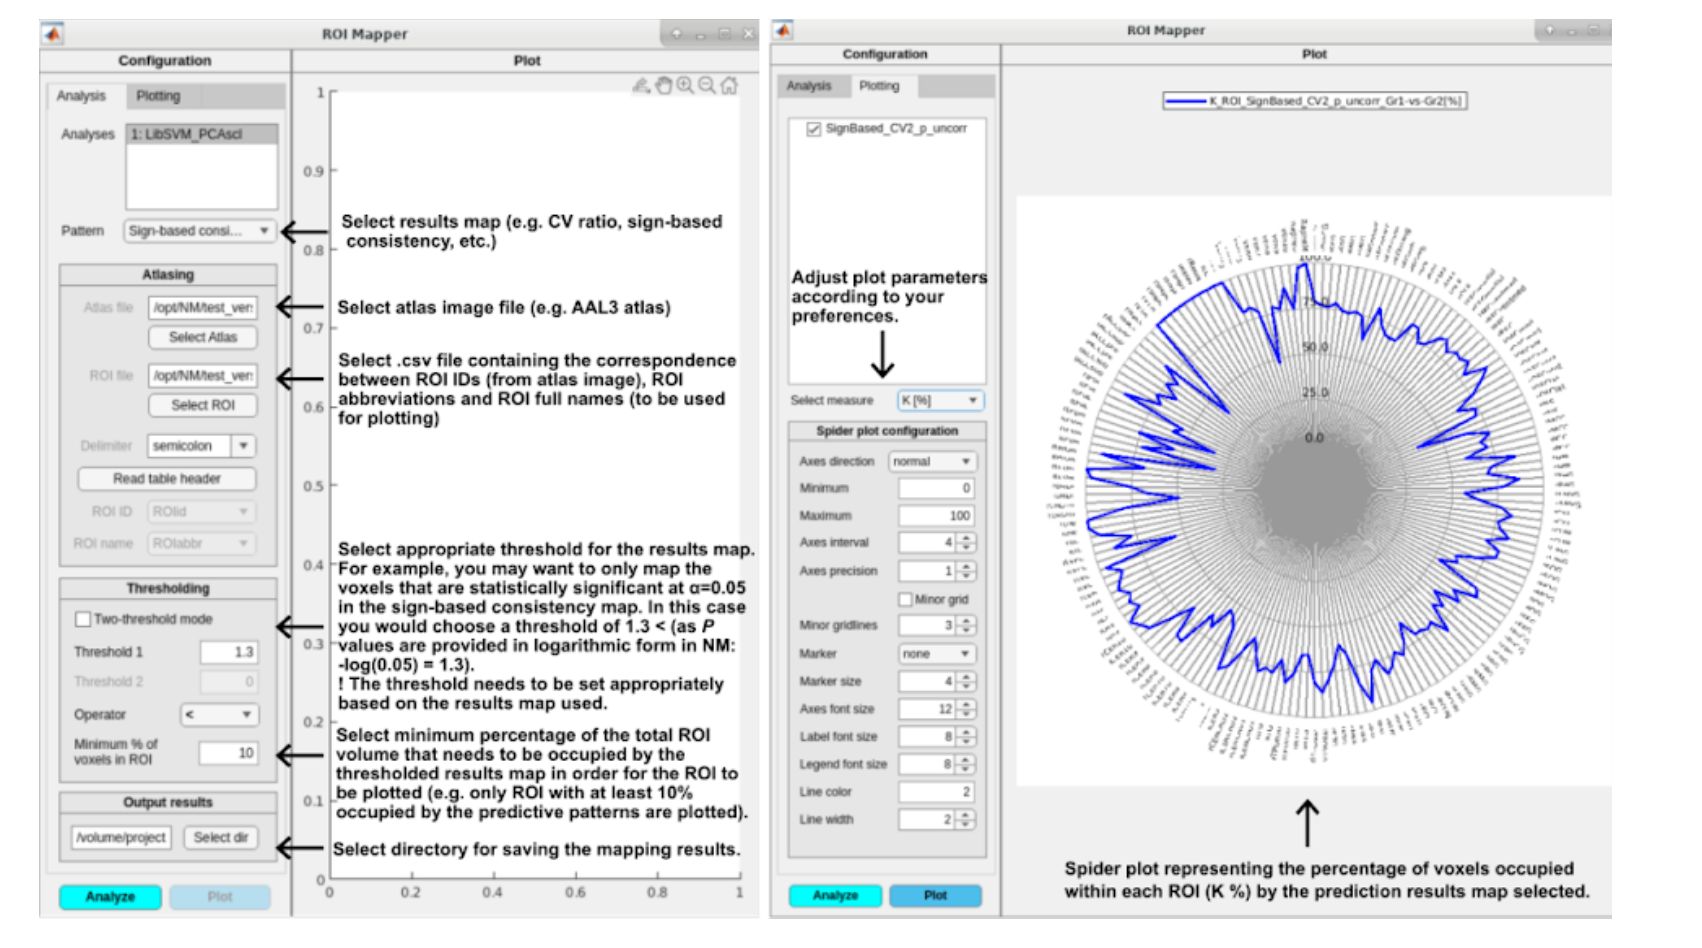
Fig. 26 ROI Mapper options for analyzing/mapping the results (left) and plotting (right).#